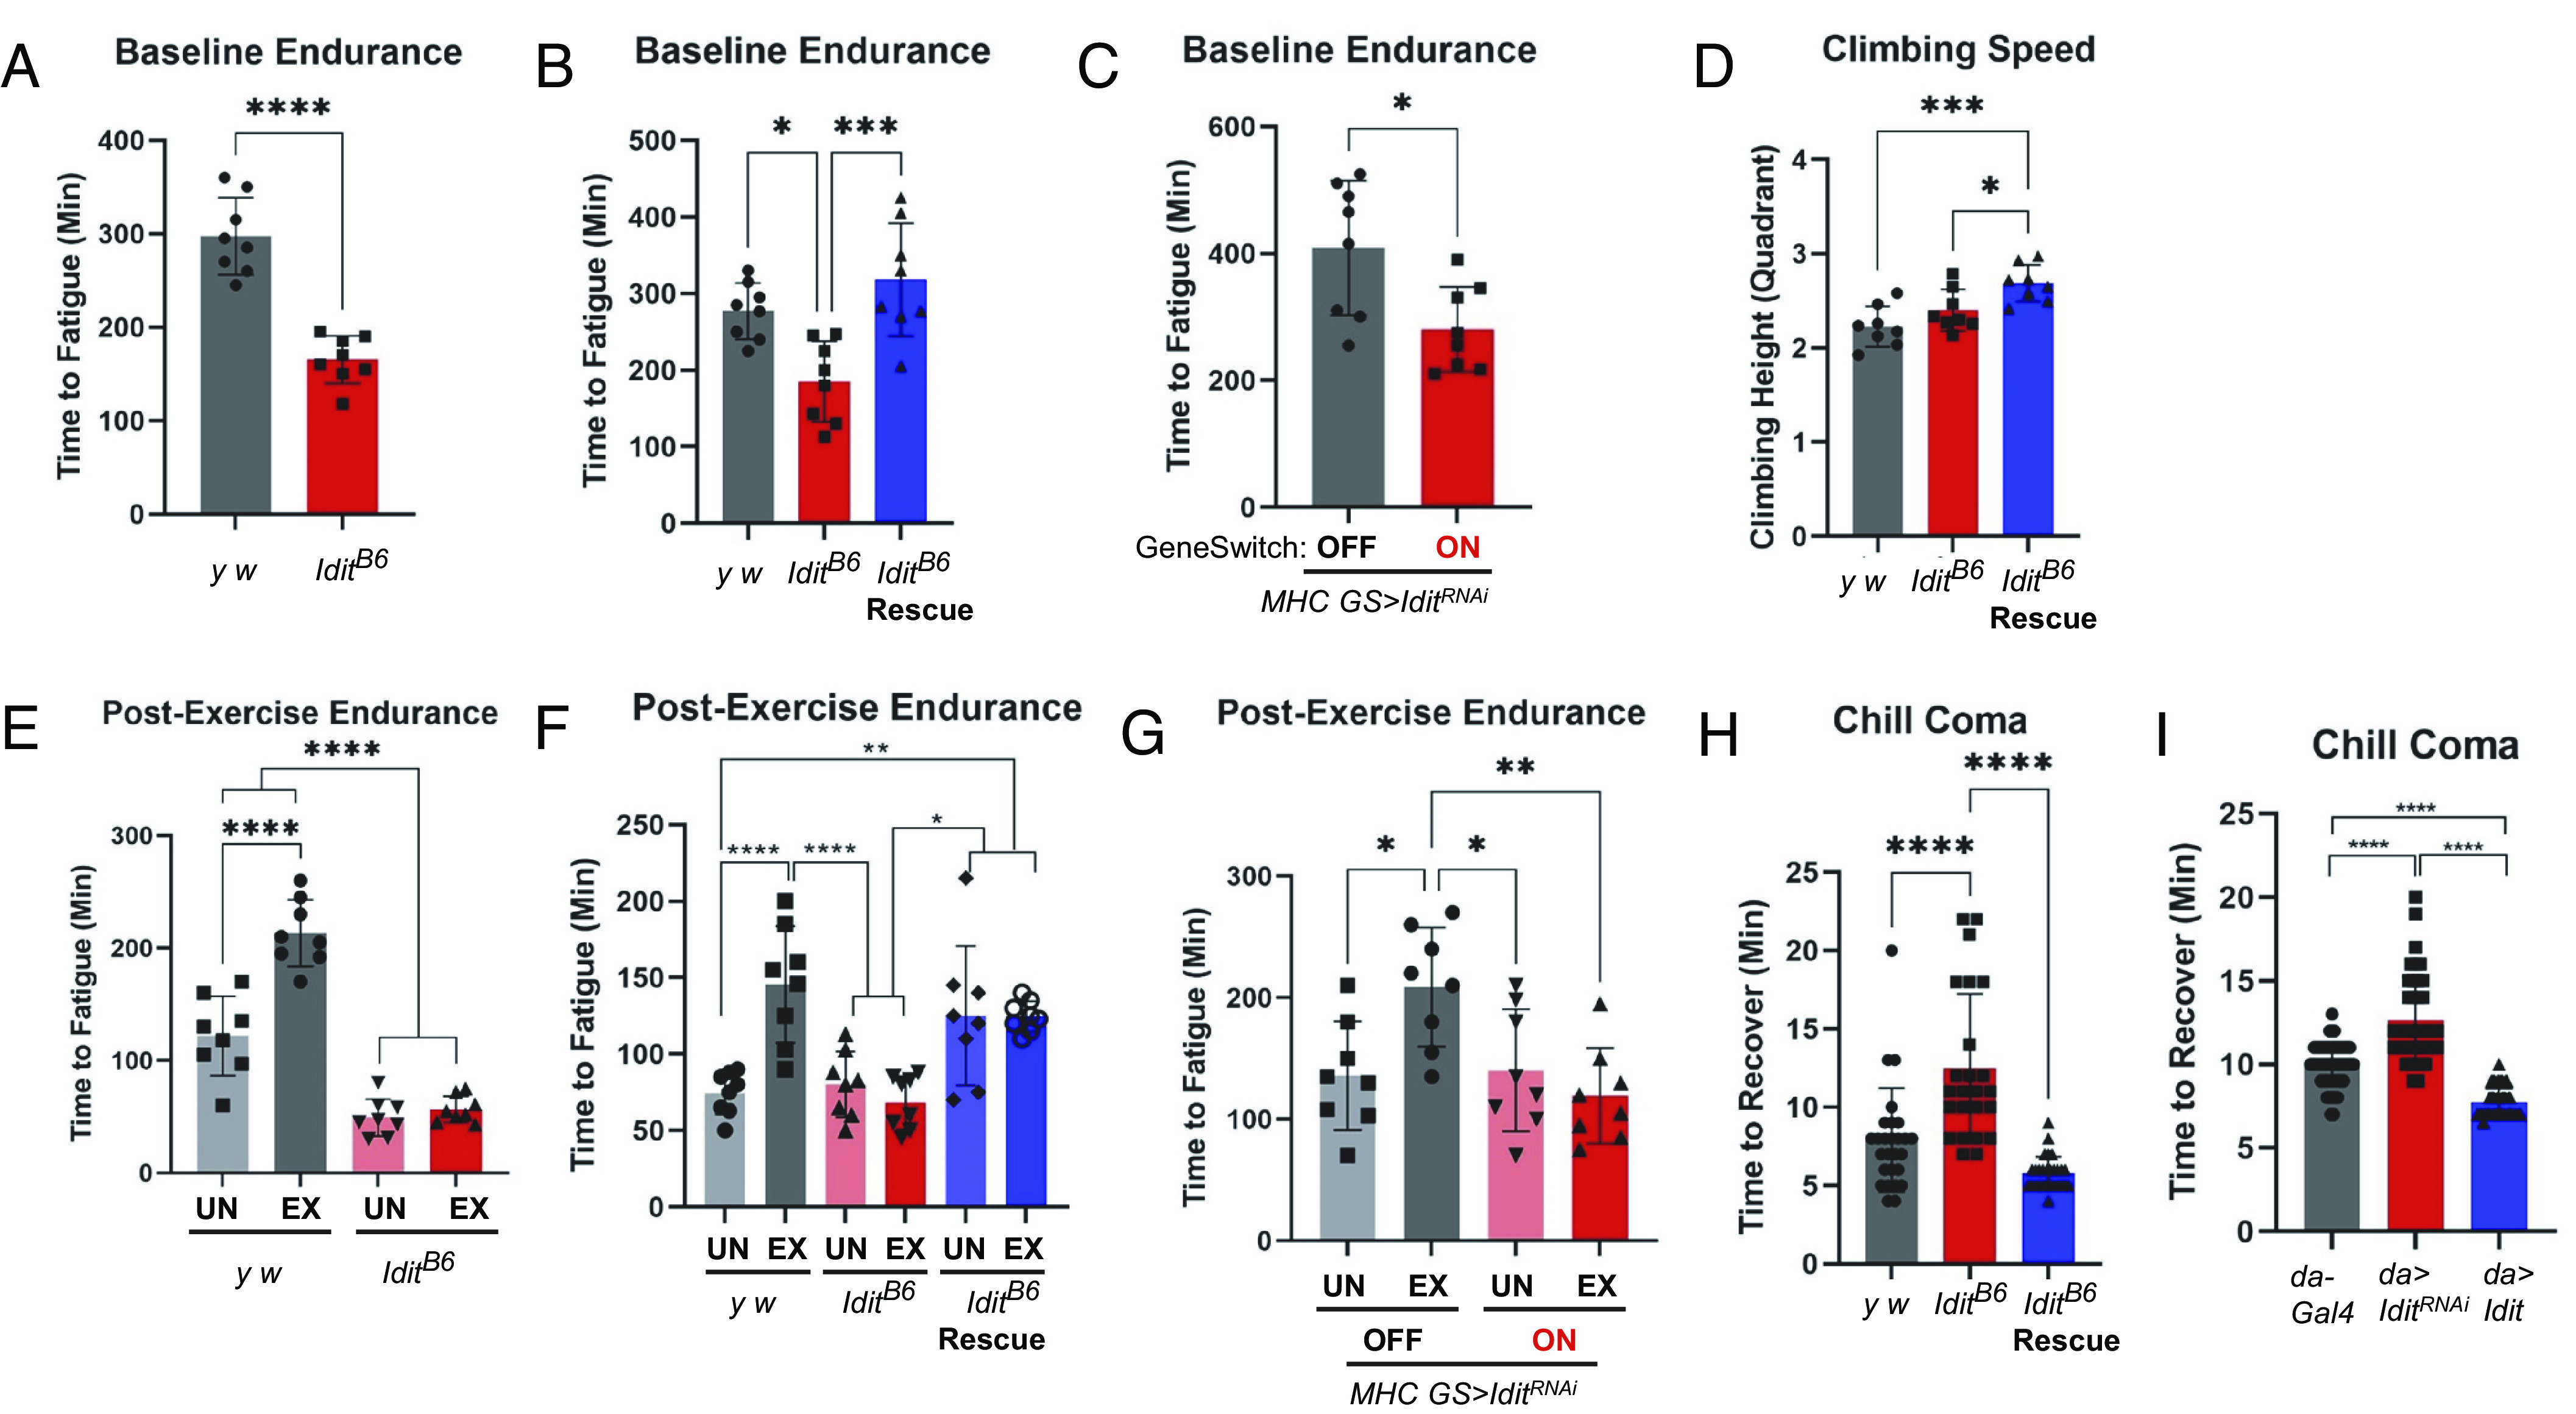
Fig. 4.

IditB6 mutants show impaired endurance and exercise response. (A–C) Baseline endurance at 5 d of age (n = 8; unpaired t-test for A and C, one-way ANOVA with Tukey test for post hoc pairwise comparisons for B). (D) Climbing speed measured as average quadrant height climbed in a 3-s negative geotaxis test (n = 8; one-way ANOVA). (E–G) Endurance of exercised (EX) or control (UN) flies at 25 d of age (n = 8; two-way ANOVA with Tukey multiple comparison; genotype by exercise interaction P < 0.01 for E–G). (H and I) Time to recovery following a 2-h chill coma (n = 24; one-way ANOVA). For C and G, MHC-GS-Gal4 was used to inducibly drive Idit RNAi expression. “ON” indicates groups fed 100 µm mifepristone and “OFF” indicates groups fed vehicle solution. For A–G, n values for endurance represent the number of vials. Each vial contained 20 flies and was scored as fatigued when less than 4 flies responded to 3 consecutive stimuli. For H and I, n values indicate individual flies. Error bars represent SD. Asterisks indicate significance from one-way ANOVA, two-way ANOVA or unpaired t test as indicated above; *P < 0.05, **P < 0.01, ***P < 0.001, ****P < 0.0001.
