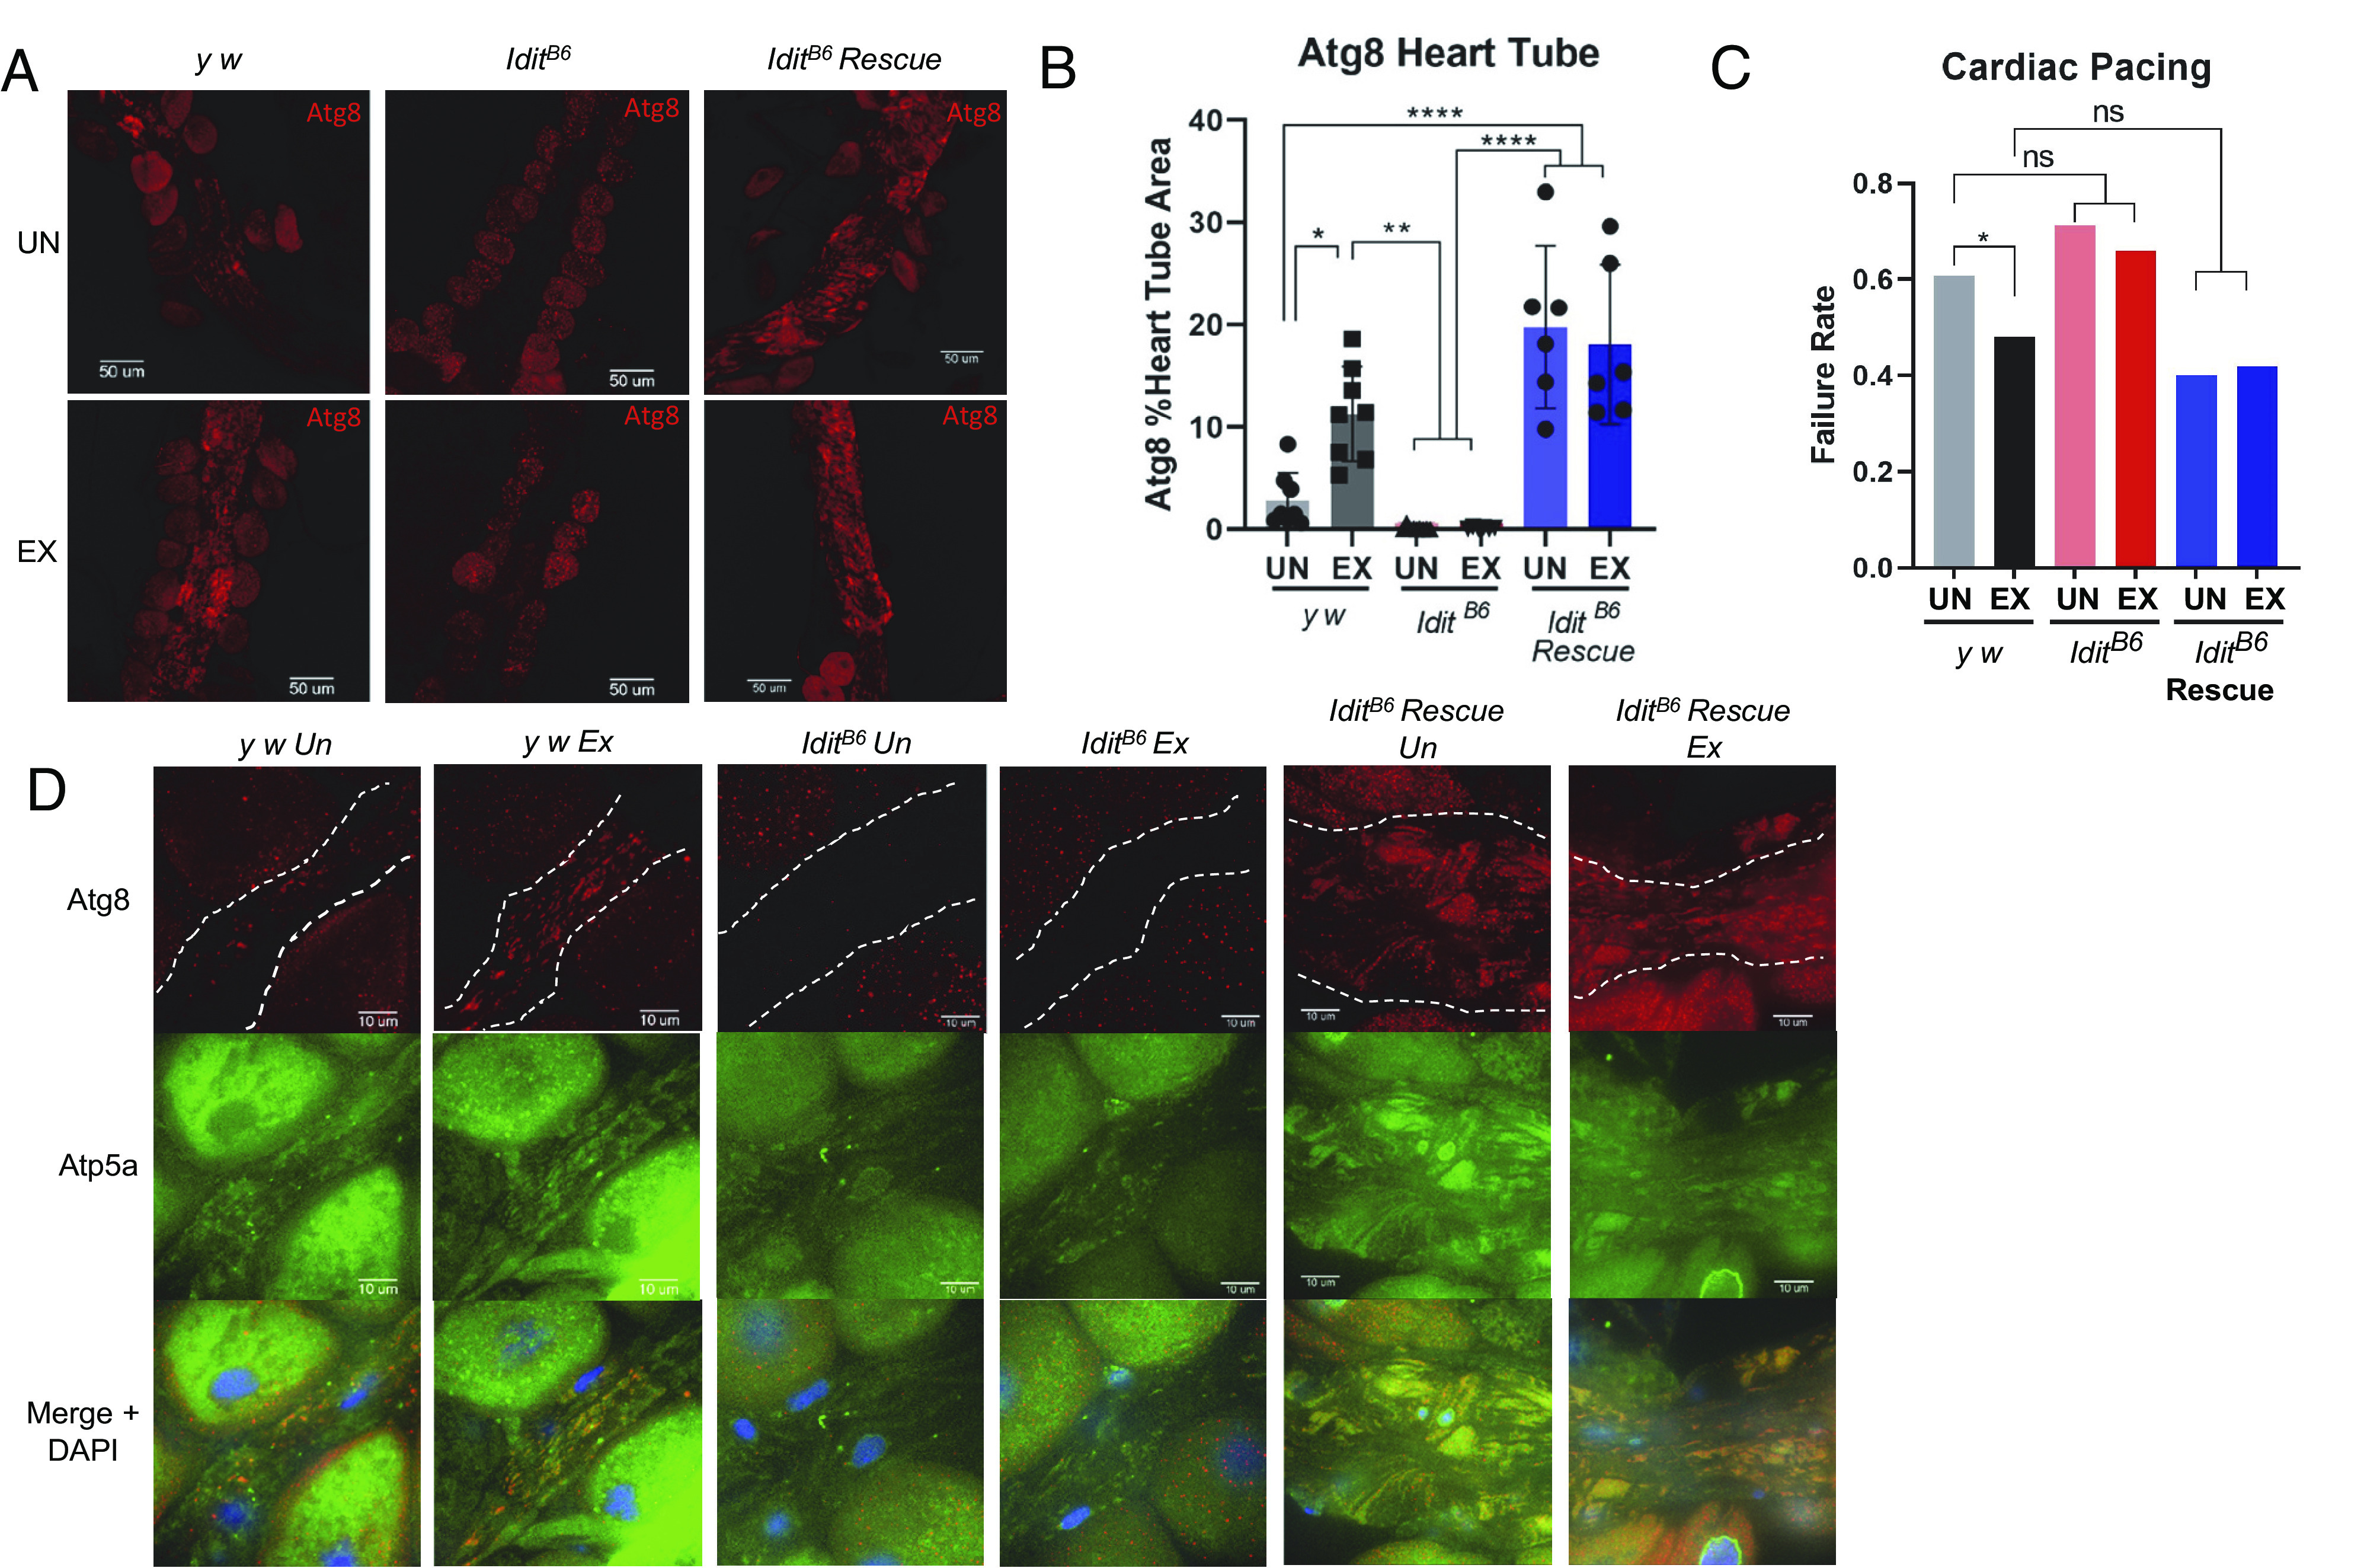
Fig. 6.

(A) Atg8 staining in dissected hearts from exercised (EX) and unexercised (UN) flies after 3-wk exercise protocol at 25 d old. Images are 20× magnification. Scale bar represents 50 µm. (B) Cardiac Atg8 fluorescence quantification from A (n ≥ 6, two-way ANOVA with Tukey multiple comparison, genotype by exercise interaction effect P = 0.01). (C) Hearts of flies were paced at 6 Hz for 30 s and immediately assessed visually for arrest or fibrillation, with either event noted as failure and the failure rate being the percentage of hearts that were in arrest or fibrillation after stimulus (n > 79, χ2 = 29.20, df = 5; P < 0.0001, Chi-square test, y1w1 ex vs. y1w1 un P = 0.04). (D) Dissected hearts of exercised and unexercised flies after 3 wk of exercise protocol stained for Atg8 (red) to mark autophagy and Atp5a (green) to mark mitochondria. Nuclei stained with DAPI. Heart tube is outlined with dotted white lines. Images are 100× magnification and scale bar represents 10 µm. Error bars represent SD. Asterisks indicate significance from two-way ANOVA in B; chi-square analysis for binary variables in C; ns = not significant. *P < 0.05, **P < 0.01, ****P < 0.0001.
