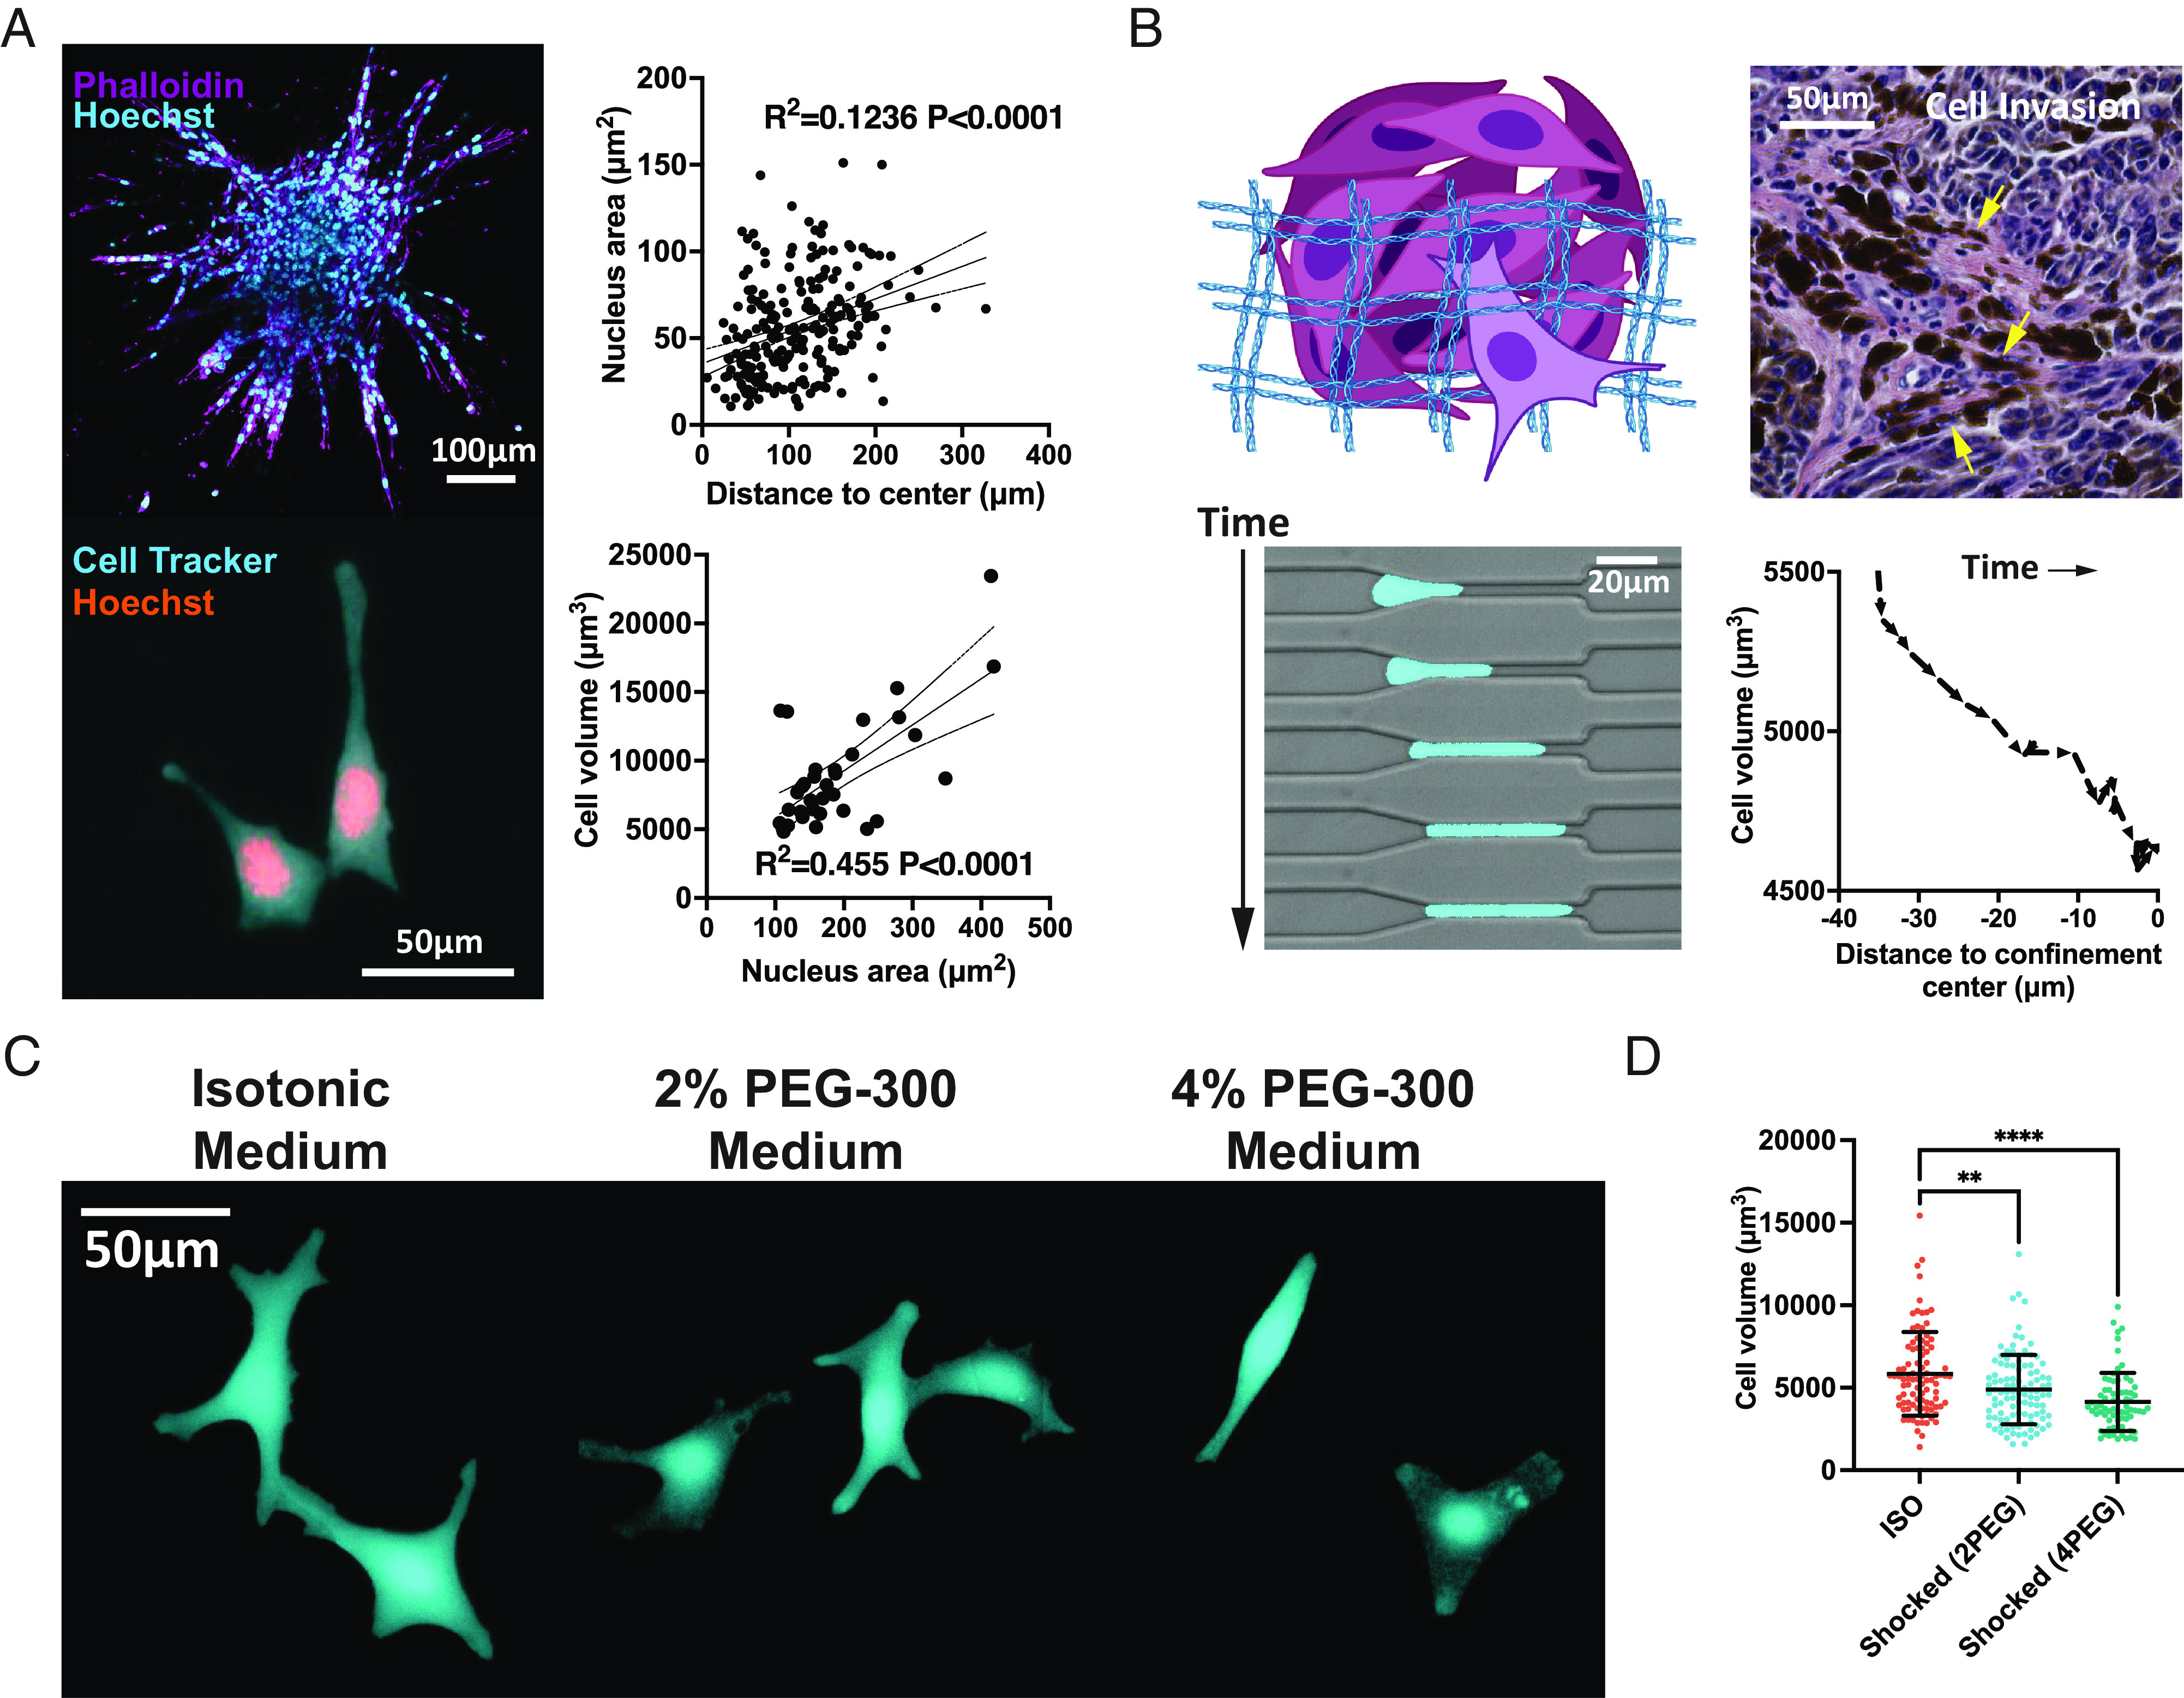
Fig. 1.

Volumetric compression of melanoma during tumor progression. (A) Upper: A YUMM cell spheroid is shown in the immunofluorescent image with F-actin and nucleus stained with phalloidin and Hoechst. A linear relationship between the cell nucleus area and the cell distance to the spheroid center is plotted (n = 229, from two independent experiments). Lower: YUMM cells that have been grown and fixed on a 2D surface are displayed in the fluorescent image. The linear relationship between the nucleus area and cell volume of YUMM cells is plotted (n = 34, from two independent experiments). The dotted curves are 95% CIs of the linear regression. (B) Upper: Schematic of a cell invading through pores in the ECM and an image of a human melanoma biopsy sample demonstrates local tumor dissemination. Lower: Fluorescent images of a YUMMER cell migrating through a confined microfluidic geometry. The YUMMER cell volume decreases as the cell is compressed by the environment when entering the channel. (C) Confocal images of live B16F0 cells at 2 h after cultured in different medium conditions. (D) The volume of B16F0 cells shocked in different medium conditions is shown (n ≥ 71 for each condition, from two independent experiments). All error bars are mean with SD. Details of statistical analyses used can be found in Materials and Methods—Statistical Analysis.
