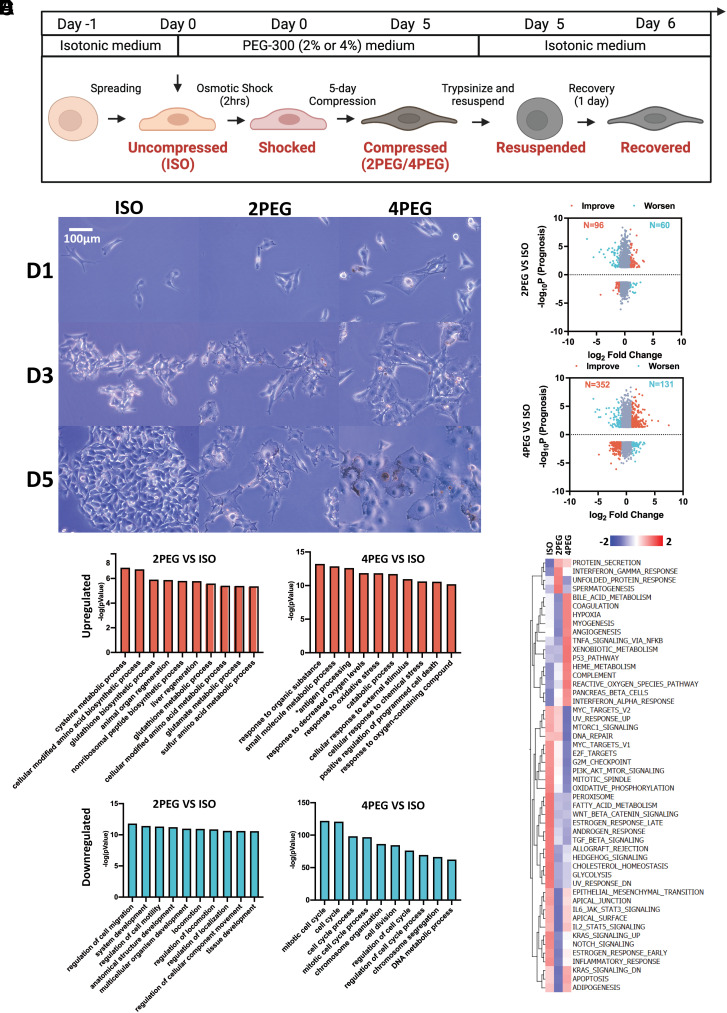
Fig. 2.
Bioinformatics analysis of compression-induced transcriptomic adaptations. (A) Schematic showing how the osmotic medium was switched throughout the experiment. (B) The images of B16F0 cells cultured in different medium conditions during the 5 d are shown. (C) The genes’ −log10P (Prognosis) values from the TCGA cutaneous melanoma dataset and their log2 fold change between 5-d compressed and uncompressed B16F0 cells. P values were calculated using the “survdiff” R package. For genes whose overexpression that have a negative impact on prognosis, their −log10P value will be multiplied by −1 to flip the gene to the negative side of the y-axis. Cutoff of abs(P) < 0.05 and abs(log2 Fold Change) > 1 were applied. The genes are colored according to whether their changes detected in the compressed conditions are associated with improvement (orange) or worsening (cyan) of the patient’s prognosis. (D and E) The top 10 ranked GO terms that are up-regulated (D) or down-regulated (E) in the compressed B16F0 cells are plotted. (F) GSVA hallmarks analysis of the uncompressed and compressed B16F0 cells is shown.

