Fig. 1.
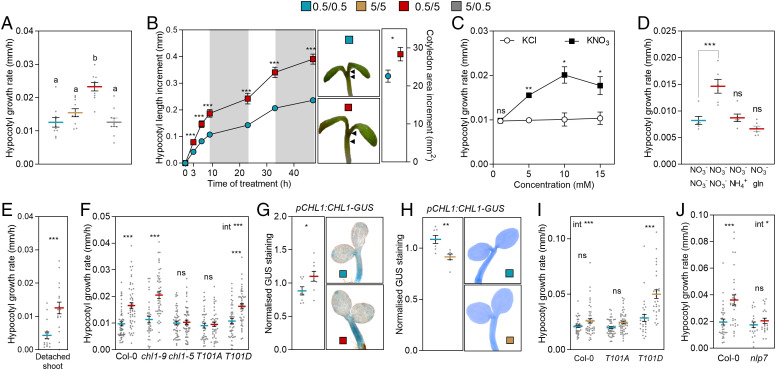
Nitrate upshifts sensed by NRT1.1 promote hypocotyl growth. (A) Hypocotyl growth rate in seedlings grown on 0.5- or 5.0-mM potassium nitrate and either transferred to the contrasting condition or left unchanged, 1 h after the beginning of the photoperiod of day 4 (growth rates measured between 1 and 10 h after the beginning of the photoperiod). (B) Kinetics of hypocotyl growth (Left) and cotyledon expansion accumulated over the same period (Right) after transfer from 0.5 to 5.0 mM nitrate, compared to the control that remained at 0.5 mM nitrate. The arrowheads define length increments in pictures of representative seedling. (C) Hypocotyl growth in seedlings transferred from 0.5 mM nitrate to the concentration of potassium nitrate or potassium chloride indicated in abscissas. (D) Hypocotyl growth rate in seedlings transferred from 0.5 to 5.0 mM nitrate or to 0.5 mM nitrate plus ammonium or glutamine to provide the equivalent amounts of nitrogen as 5.0 mM nitrate. (E) Hypocotyl growth in shoots isolated from their roots 1 h after the beginning of the photoperiod of day 4 and incubated the subsequent 9 h in 0.5- or 5.0-mM nitrate. (F) Hypocotyl growth rate in seedlings of the Columbia wild type and the following alleles of NRT1.1: chl1-9 (deficient in transport), chl1-5 (null), chl1-5 complemented with NRT1.1T101A (nonphosphorylatable) and chl1-5 complemented with NRT1.1T101D (phosphomimetic). (G) GUS staining in the hypocotyl driven by the pCHL1:CHL1-GUS transgene, 4 h after the shift in nitrate. (H) GUS staining in the hypocotyl driven by the pCHL1:CHL1-GUS transgene, 5 h after the beginning of the photoperiod of day 4. (I) Hypocotyl growth rate in seedlings of the Columbia wild type and the chl1-5 null mutant complemented with either the NRT1.1T101A (nonphosphorylatable) or NRT1.1T101D (phosphomimetic) alleles. (J) Hypocotyl growth in the nlp7-2 mutant. Data are means ± SE and individual values (A and D–J) and means ± SE of 7 (B) or 3 (C) replicate boxes of seedlings. Different letters indicate significant differences (P < 0.05) in Tukey tests. Asterisks indicate the significance of the effect of nitrate in Student’s t tests or Bonferroni tests following significant interaction (int): *P < 0.05; **P < 0.01; ***P < 0.001; ns, not significant.

