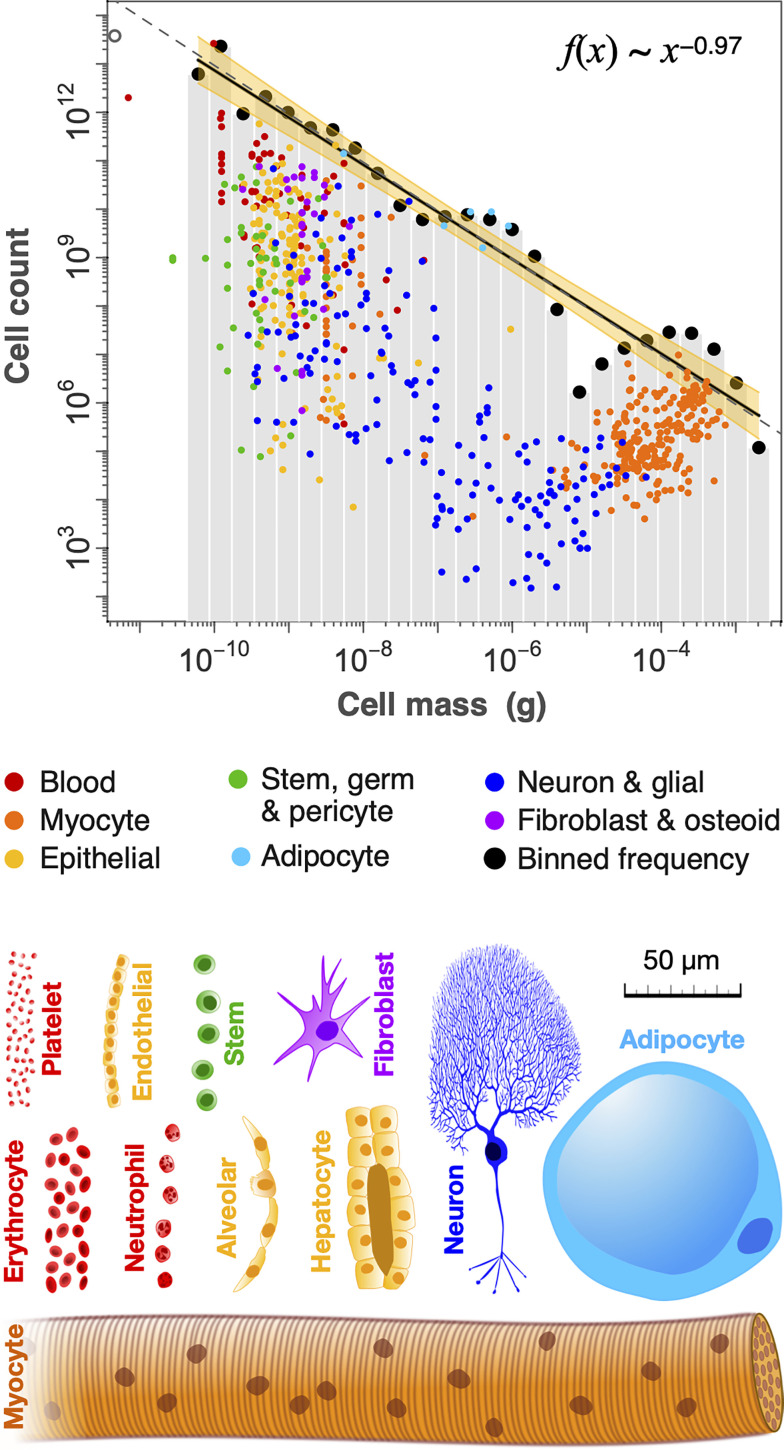
Fig. 3.
Human cell size and count are nearly inversely related. Data and regression are shown for a 70-kg reference male, though very similar patterns are found for female and child (SI Appendix, Fig. S5). The total number of cells in each of 26 logarithmic size classes is regressed against cell mass (g), giving a slope near −0.97, as shown by the black line fit to black circles. The yellow band shows the 95% CI (±0.1), while the dashed gray line shows a reference slope of −1. Small colored circles (n = 700) include 401 distinct cell types, in addition to single cell types that have large variation in size (e.g., adipocytes, neurons and myocytes). These points represent mean cell-size values for each cell group, and are aggregated over their size range into size class sums represented by black points (Materials and Methods). In some cases, cells with broad size distributions (e.g., adipocytes; light blue) have counts of mean sizes that are higher than the size class sum (black points), since the counts of actual sizes are spread lognormally over multiple size classes. The open gray circle (Top Left) is the bacterial microbiome (17).

