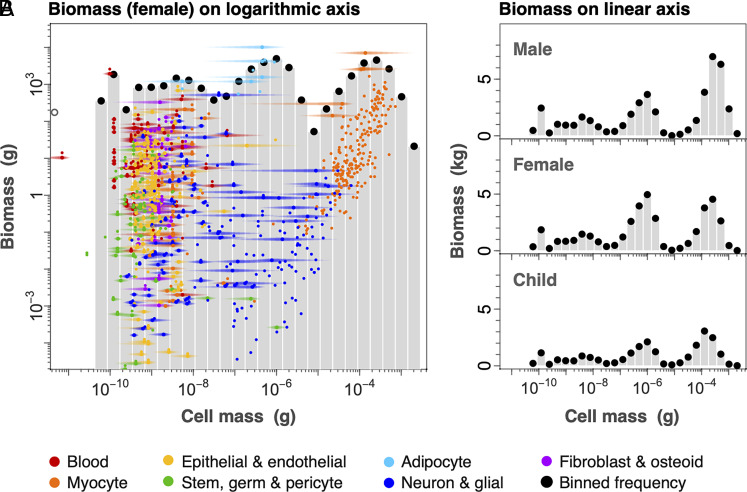
Fig. 4.
Cellular biomass and cell-size variation. The number of cells in a group multiplied by cell mass gives total biomass of a cell group. (A) Numerical counts (from Fig. 3) are transformed to total cellular biomass within a size class, and show little systematic variation with log cell mass. Here we show female cell biomass, which is broadly similar to the male and child (as shown in B on linear axes). Horizontal colored bands represent approximate size ranges based on literature values. In some cases, the biomass of a cell type (colored points) may be greater than the size class sum if that cell type is broadly distributed (e.g., adipocyte and myocyte). (B) Cell biomass can also be displayed on linear axes to highlight irregularities, particularly among the largest cell types (adipocytes and myocytes). Male, female, and 10-y-old child are broadly similar, though the child displays a slightly more even distribution of biomass (SI Appendix, Fig. S5).

