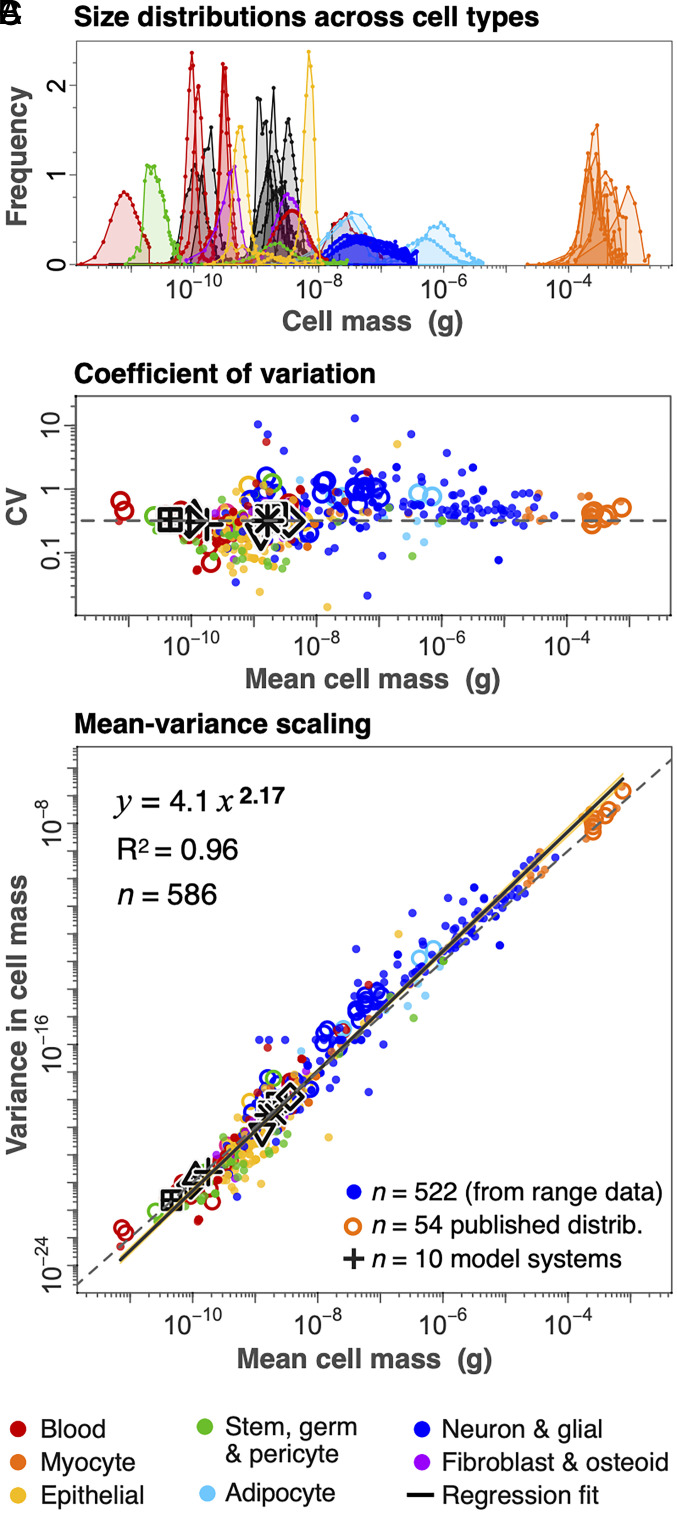
Fig. 5.
Size variation across cell types. (A) Published size distributions of select human cell types (colored; n = 30) and cell-size model systems (gray; n = 10) are normalized and found to be well approximated by a log-normal distribution (Materials and Methods; SI Appendix, Fig. S2). (B) The CV (SD divided by mean cell mass) shows little tendency to vary systematically with mean size across the full range of cell types. (C) The variance in cell mass for each cell type scales as a power law with exponent 2.17 (±0.04) against mean cell mass across all cell groups. Small solid points in B and C derive from estimates of SD from size ranges in our dataset (n = 522). Open circles (n = 54) are from prior published distributions and black shapes (n = 10) are from cell-size model systems shown in A (see SI Appendix, Fig. S2 for legend, and Materials and Methods and SI Appendix for sources).

