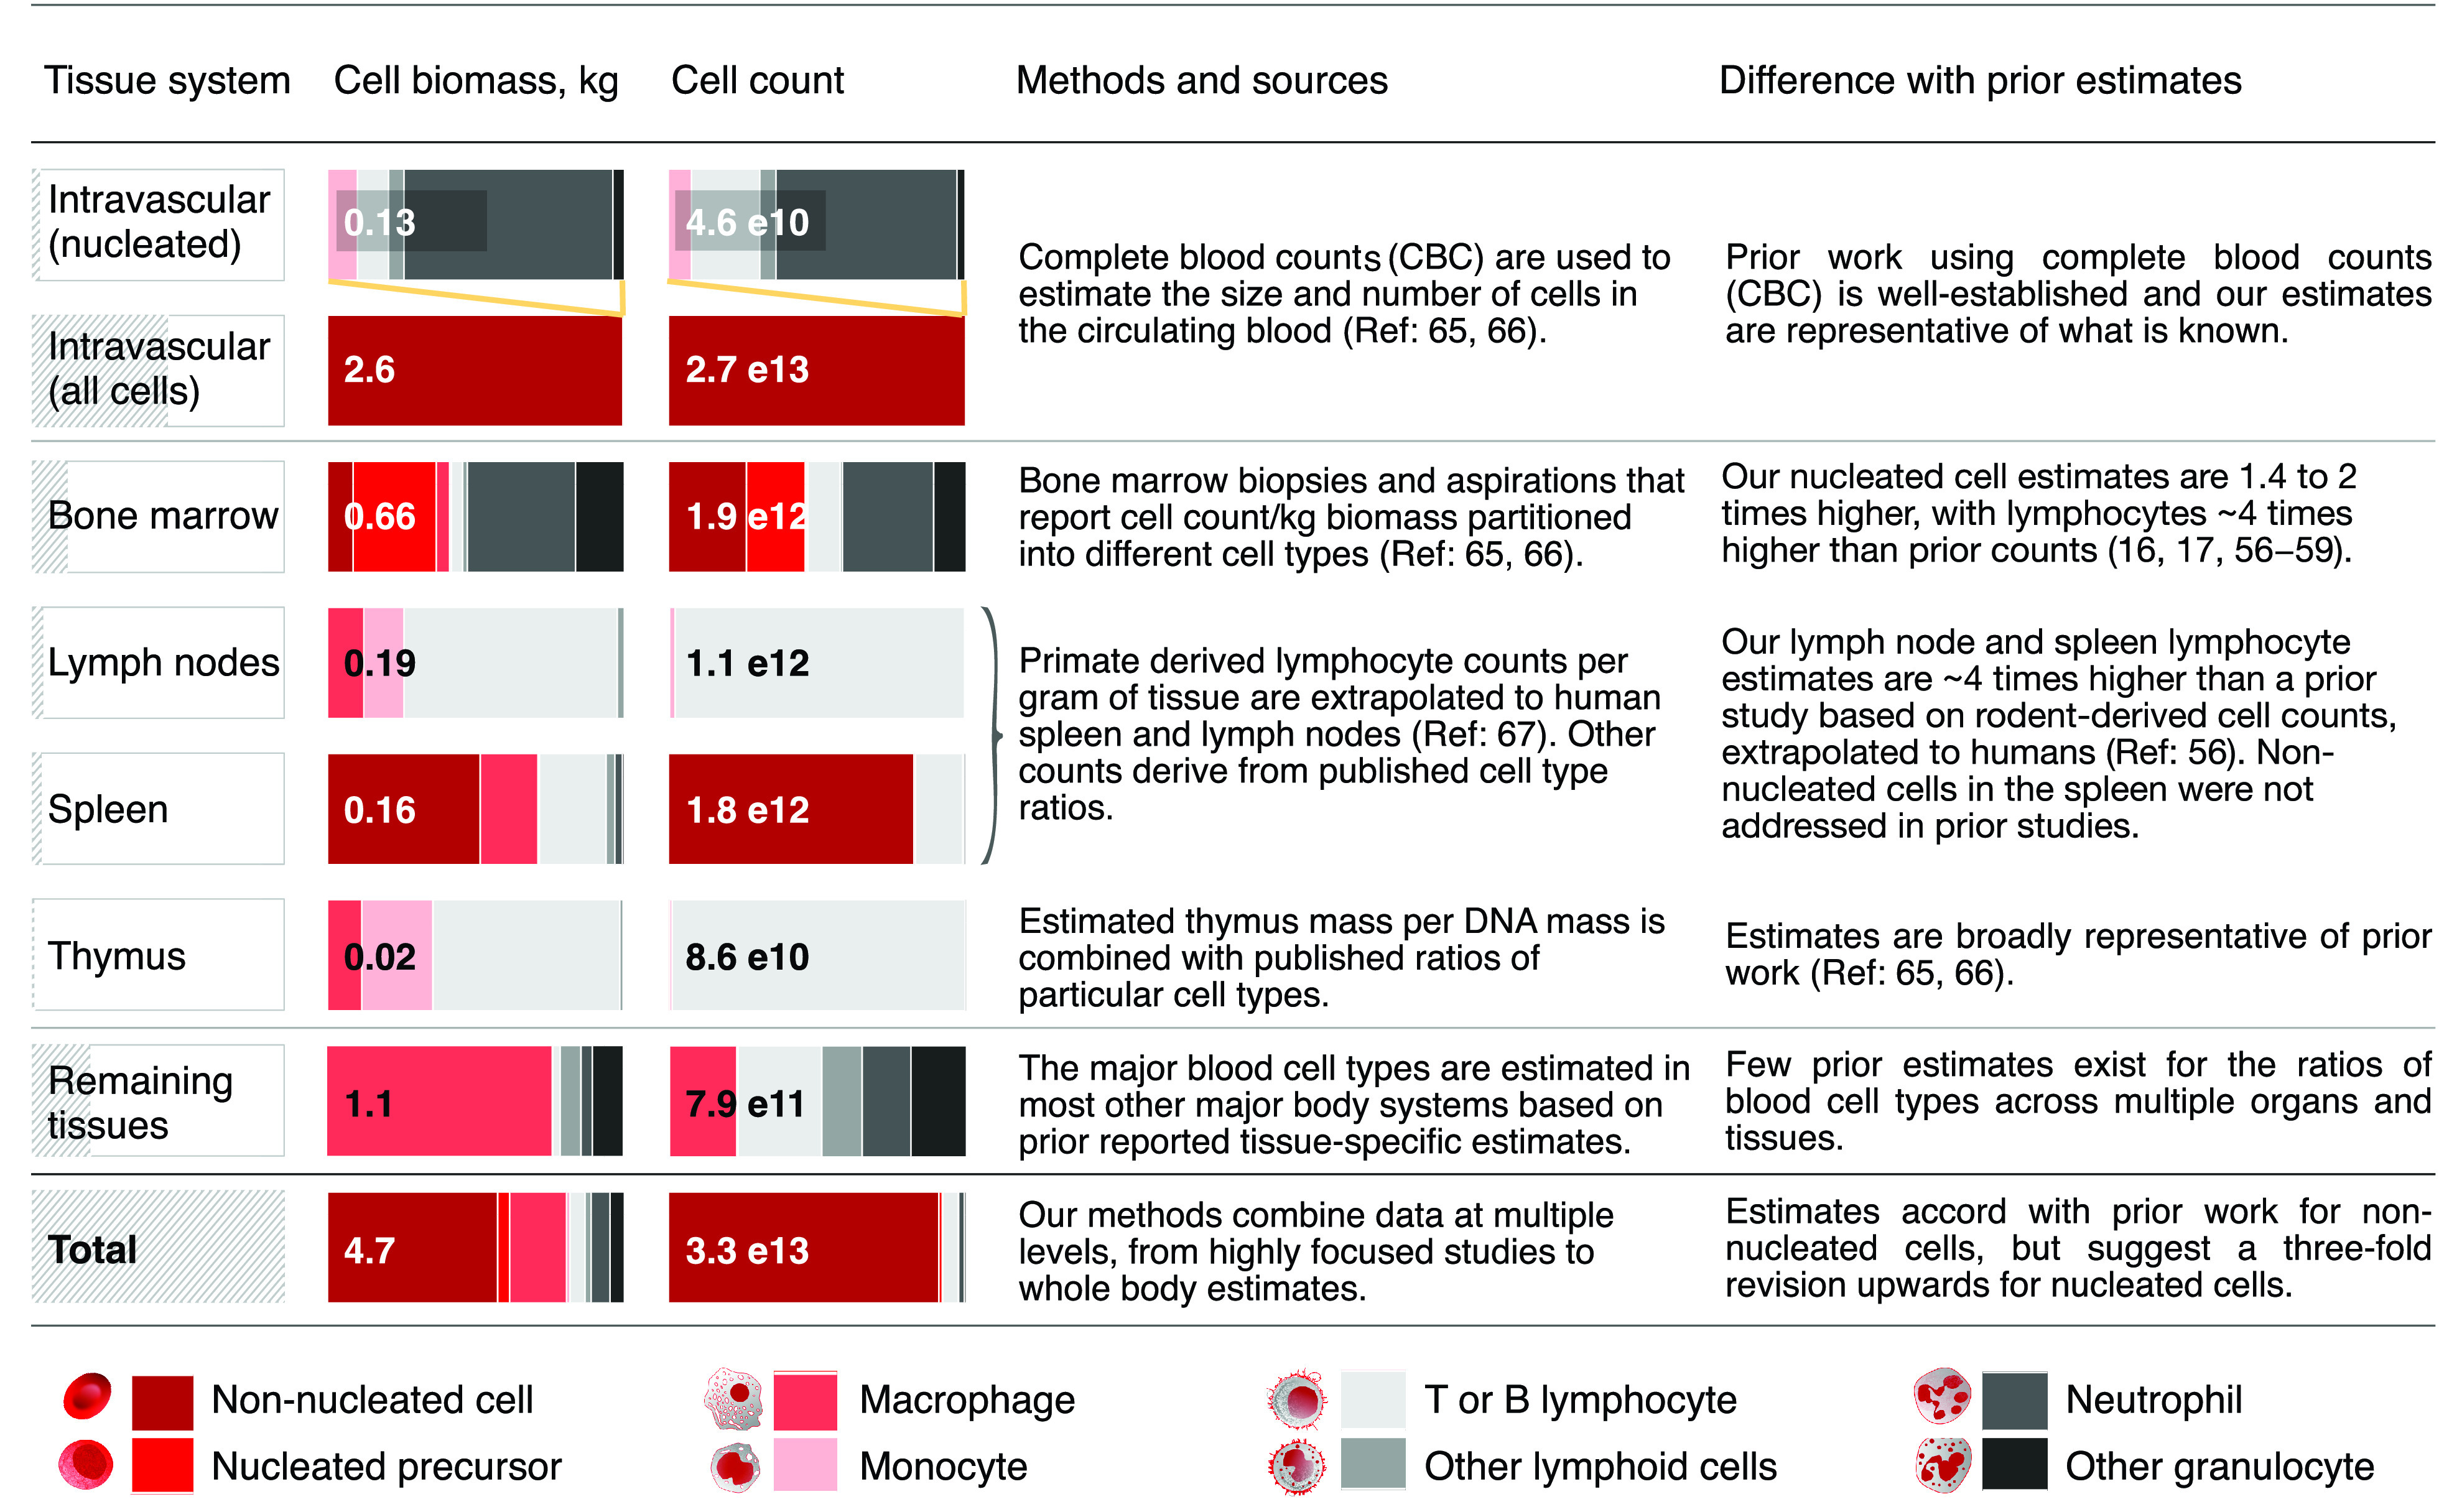
Fig. 6.

Summary of blood cell distribution across blood organs and other tissues. Blood cell size and count are estimated for each of the intravascular, major blood organs and over all remaining tissues. Numerical values refer to a reference male. These estimates derive from reported total biomass of each major tissue system. The relative biomass fraction for each tissue is shown as a hatched shaded gray bar in the leftmost column. The first row (intravascular) shows the same data as the second, except that nonnucleated red blood cells and platelets are removed (as in Fig. 1A). Total cell biomass (kg) and cell count in each system are partitioned into eight blood cell groups (colored bars) based on a variety of methods. We highlight where our methods and estimates differ with prior published sources.
