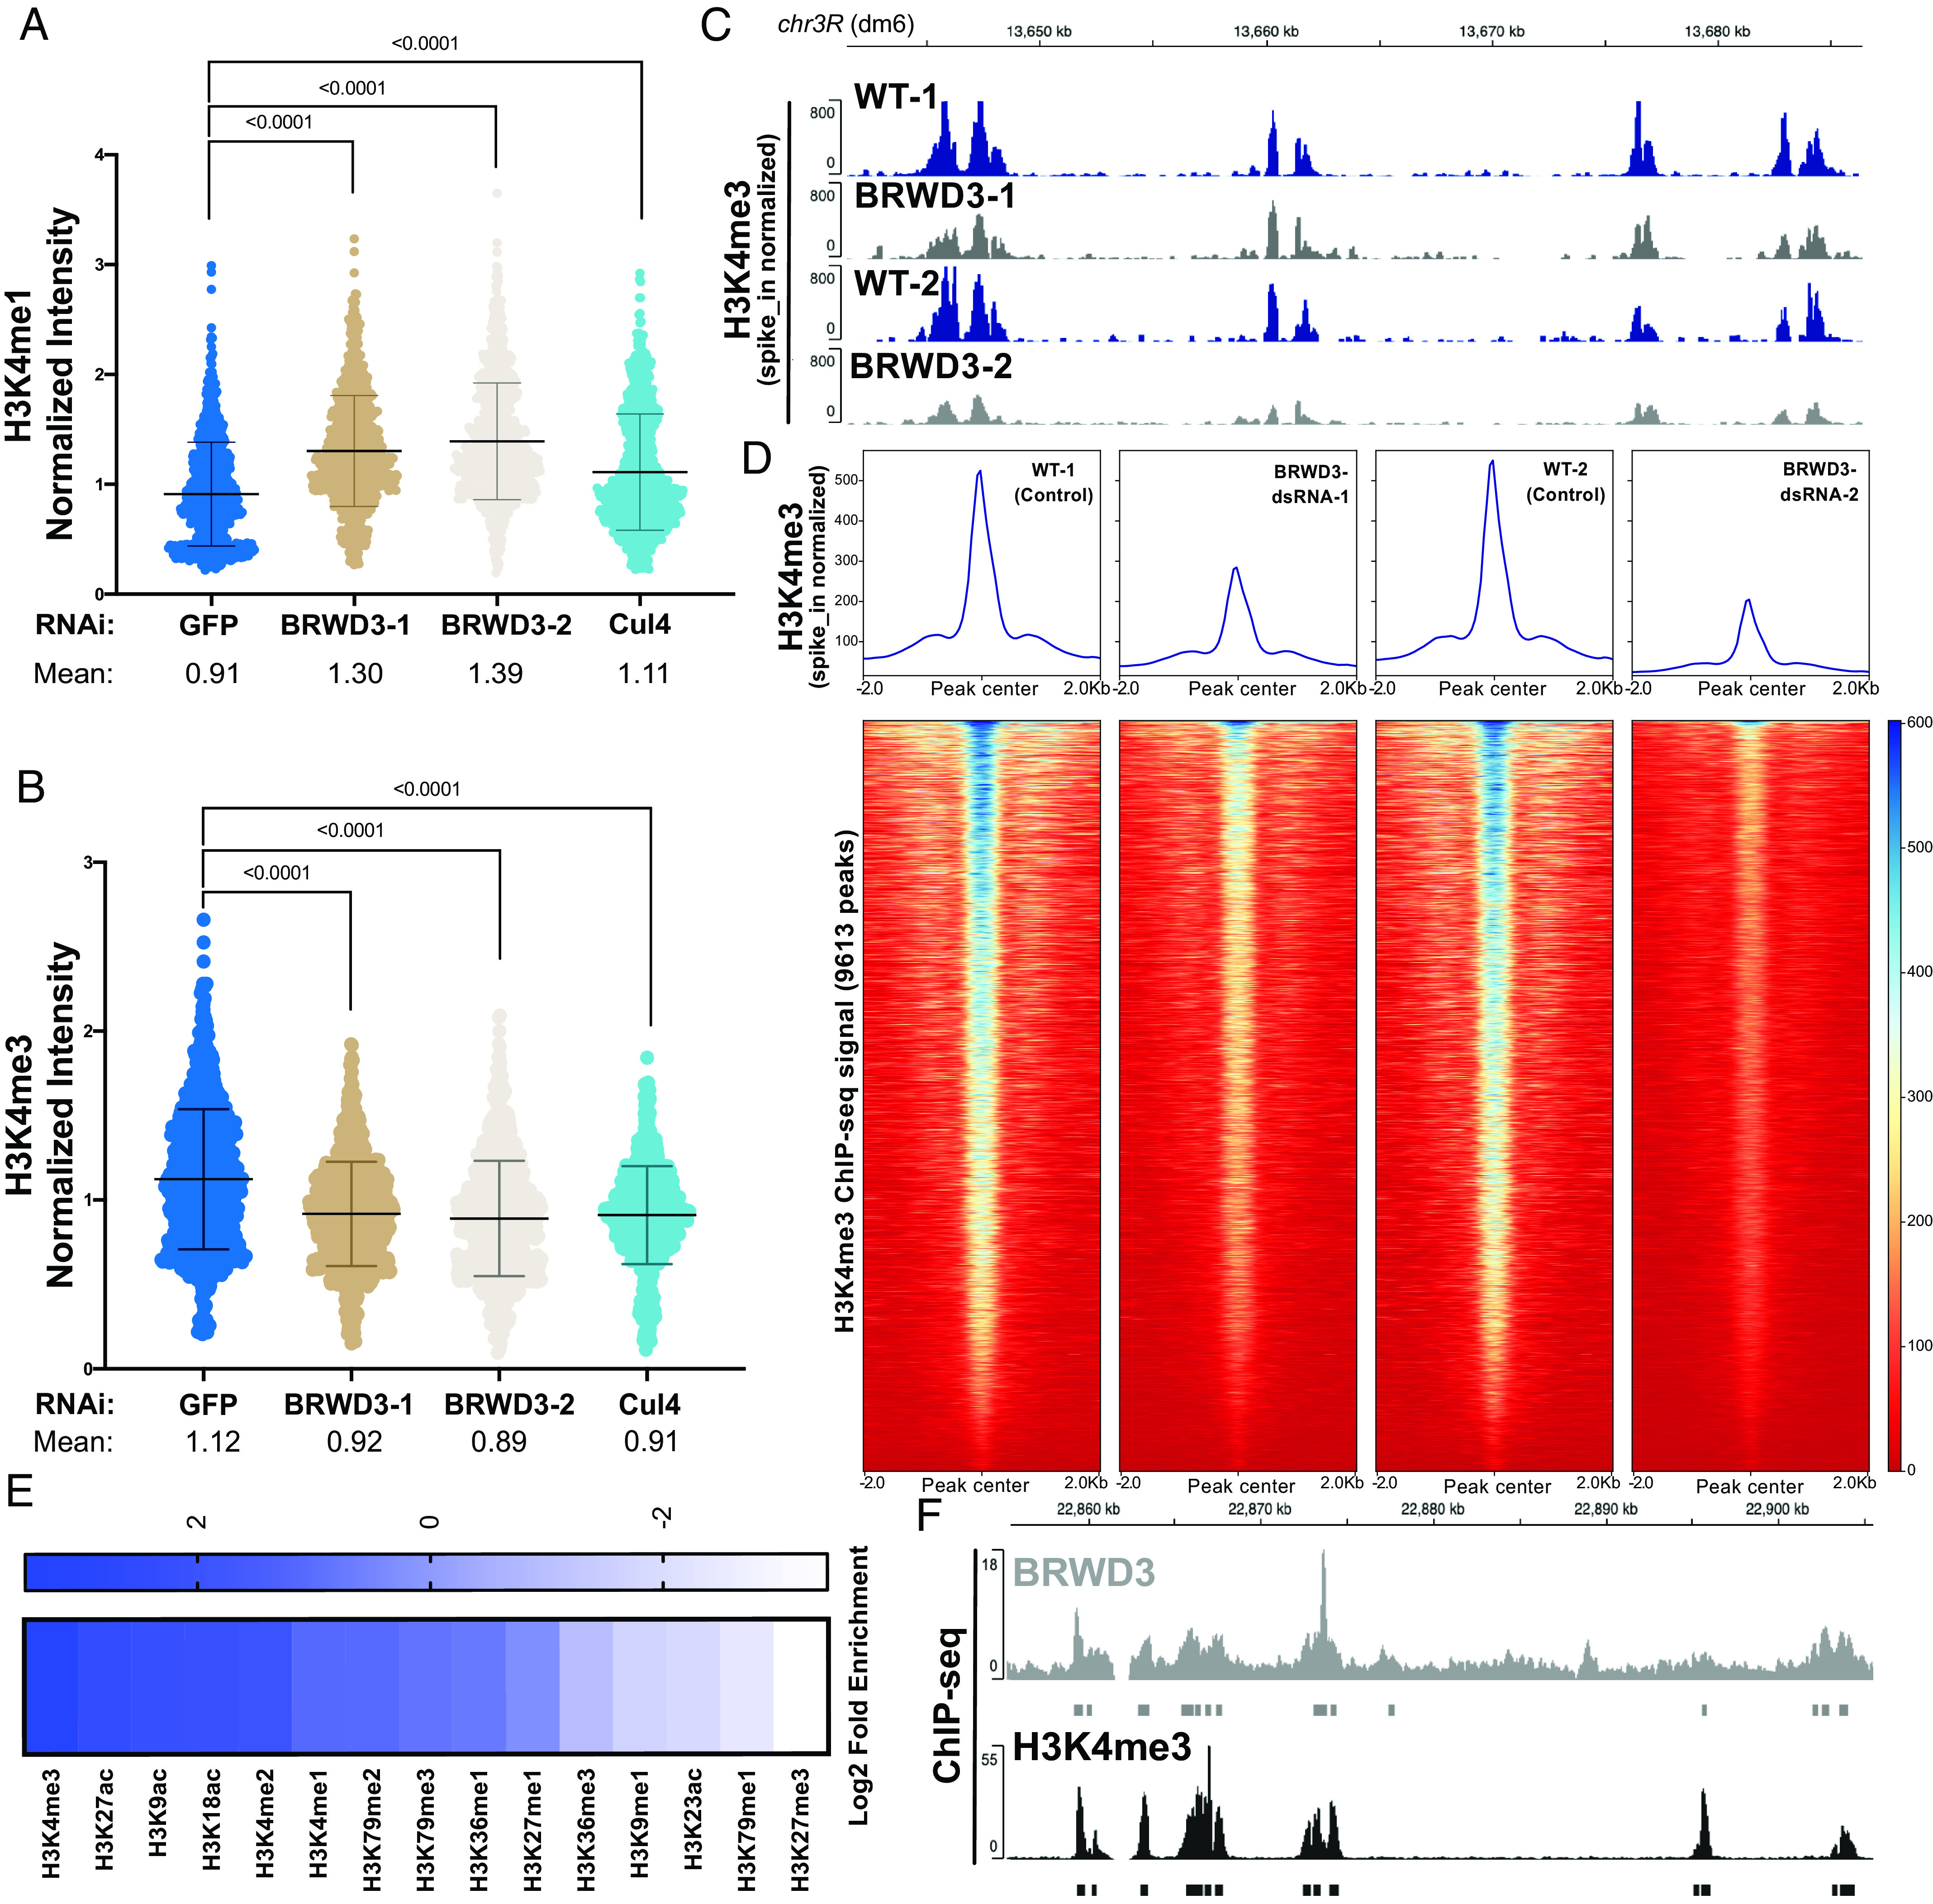
Fig. 1.

BRWD3 affects H3K4 methylation status. Quantification of H3K4me1 (A) and H3K4me3 (B) intensity using quantitative IF in Drosophila S2 cells. Each dot presents the H3K4 methylation intensity per nucleus normalized to the total DNA content. Each distribution represents the signal intensities of 1,000 randomly selected cells from three biological replicates. P < 0.0001 using an ANOVA one-way analysis with Tukey's multiple comparisons test. (C) Representative H3K4me3 spike-in normalized ChIP-seq profiles generated in S2 cells with no dsRNA control (WT) and BRWD3 depletion using two independent dsRNAs (Methods). (D) Enrichment heatmap of spike-in normalized H3K4me3 ChIP-seq signal sorted by mean occupancy around the centers of all published H3K4me3 peaks. (E) Enrichment of H3 marks within BRWD3 binding sites. Log2 enrichment for observed overlap relative to expected overlap for each mark peak set is shown. (F) Representative view showing the similarity of BRWD3 and H3K4me3 ChIP-seq tracks. Data were from ref. 19.
