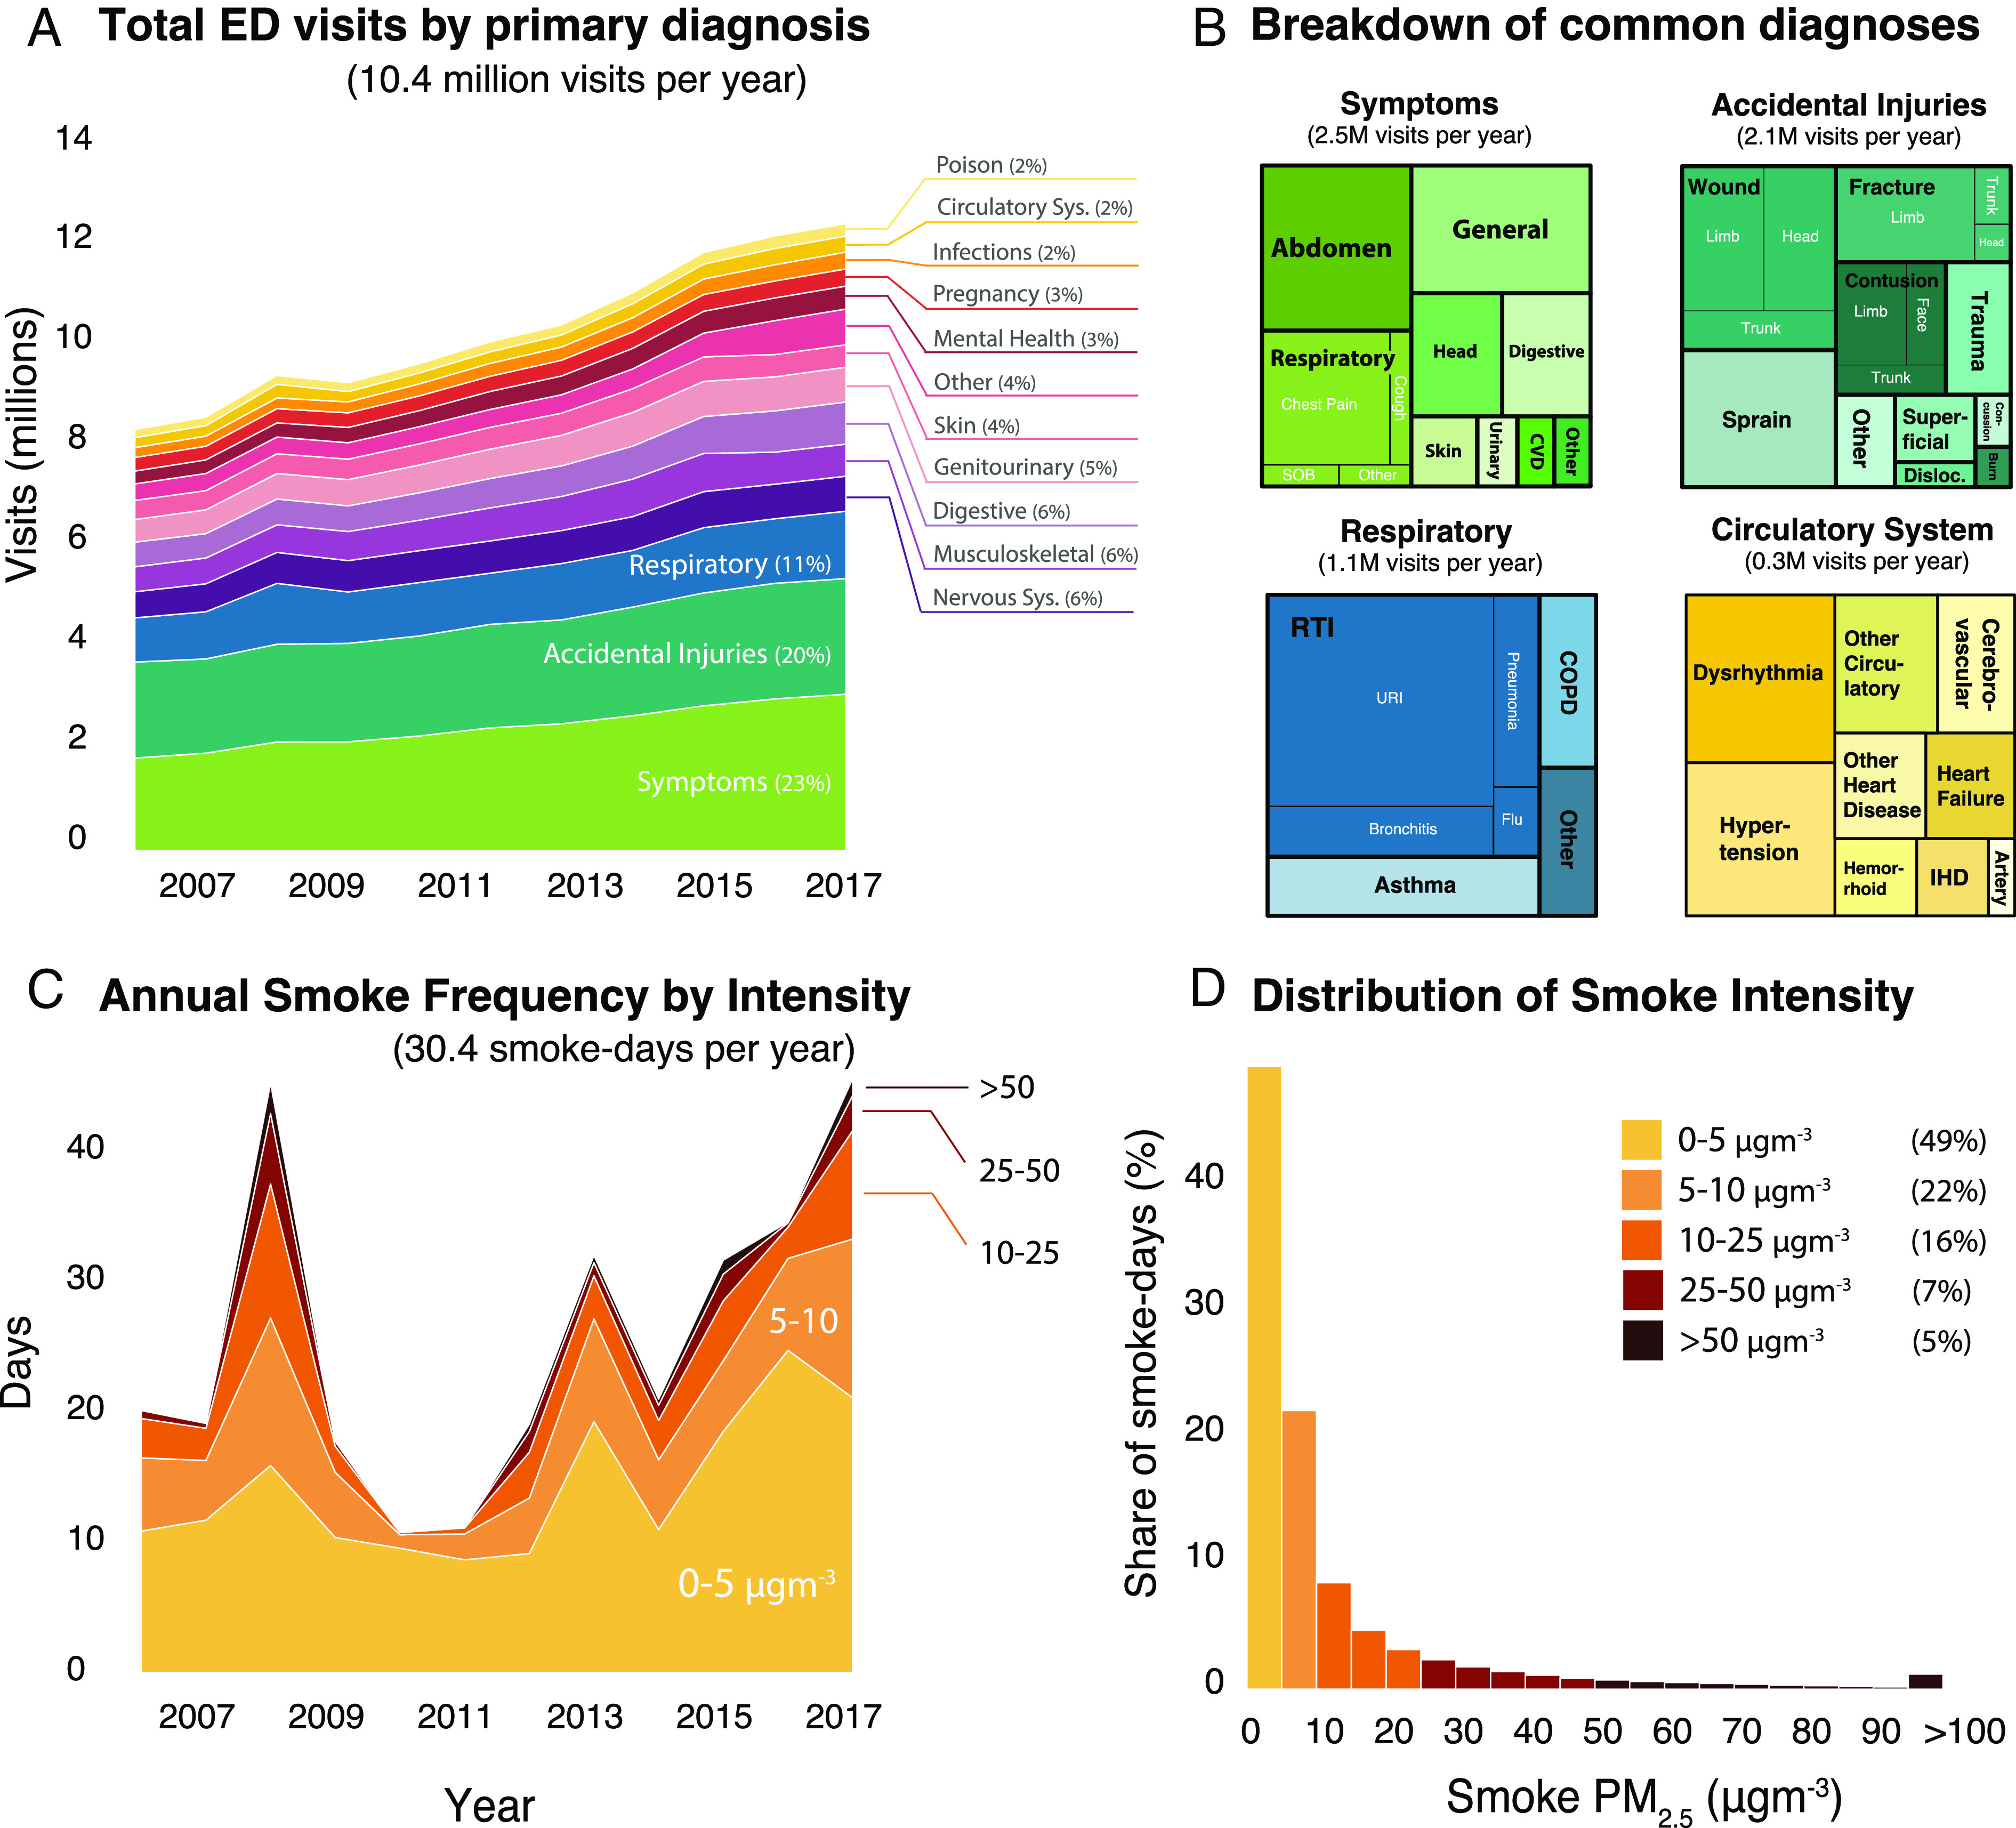
Fig. 1.

Data summary. (A) Annual total ED visits in California 2006-2017 broken down by primary diagnosis (SI Appendix for International Classification of Diseases (ICD) codes corresponding to each group). (B) Subgroup breakdown for relevant diagnoses. Black labels indicate broader categories, while white labels indicate subcategories. (C) Annual population-weighted average wildfire smoke days in California color coded by concentration of PM from smoke. (D) Histogram of smoke PM concentration on days with smoke present. Nearly half of smoky days 2006 to 2017 had smoke PM less than 5 while 5% of smoky days had smoke PM over 50 .
