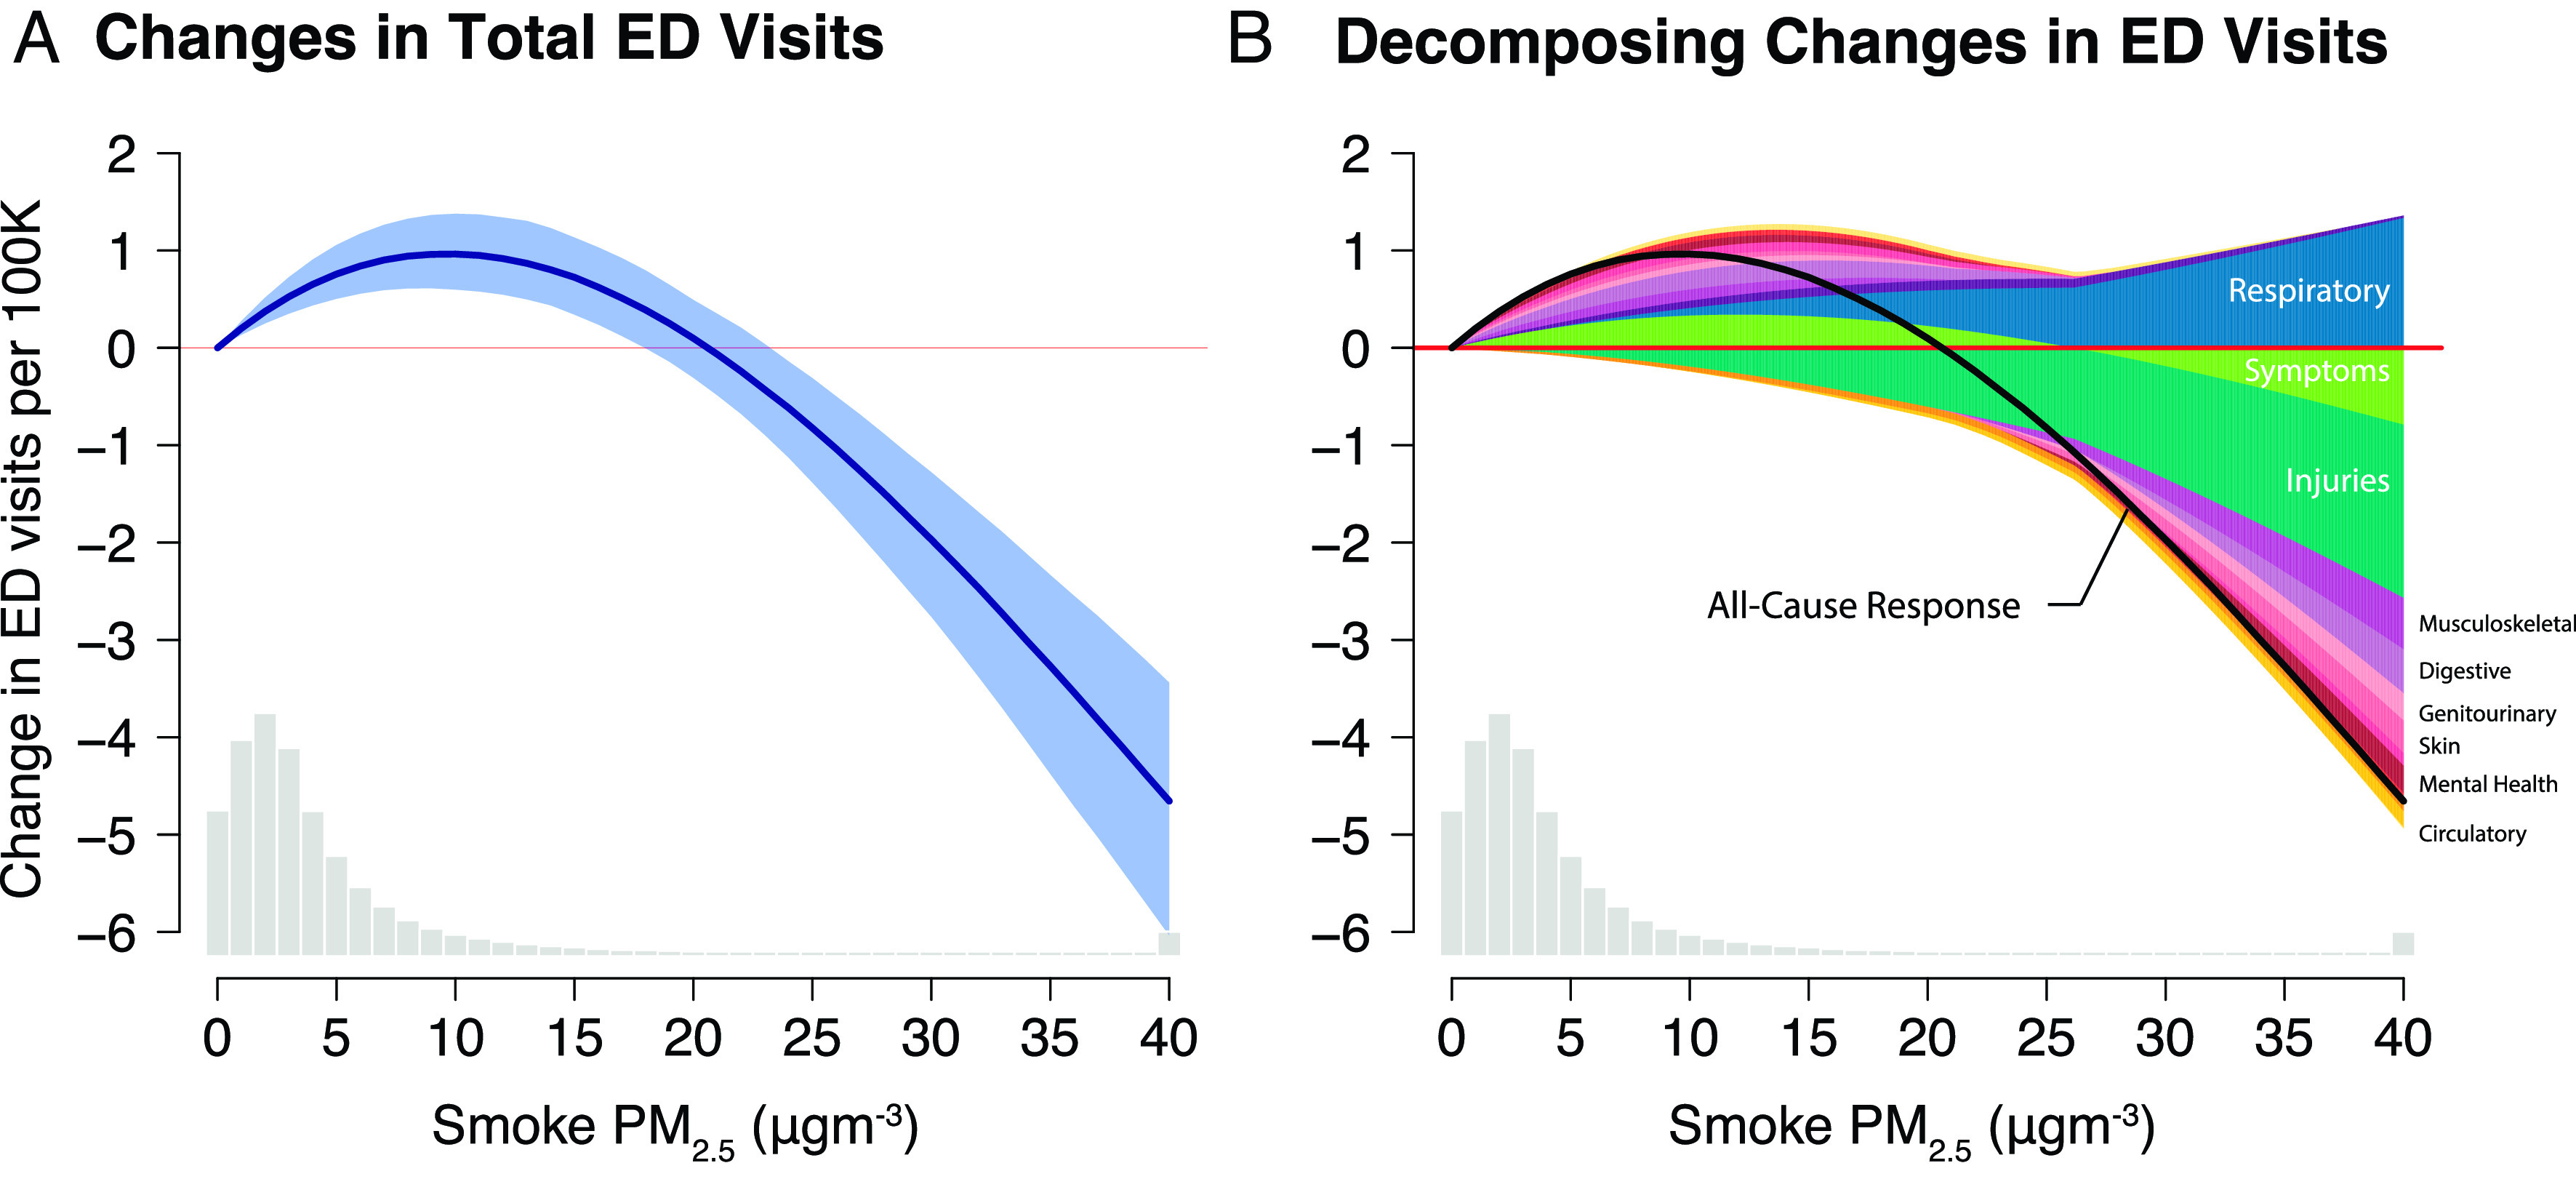
Fig. 2.

All-cause ED visits increase with additional exposure to moderate levels of smoke pollution but decline dramatically on the most extreme days. (A) The estimated all-cause response is derived from a zipcode-level distributed lag regression model of daily ED visit rates on a 4th-degree polynomial of wildfire smoke intensity measures for the 7 d prior through day-of visit Eq. 2. Coefficient estimates at each level of smoke intensity were summed across lags to estimate the total effect of an additional day at a given exposure intensity on ED visits in the following week. The shaded area indicates bootstrapped 95% CI (Materials and Methods). The histogram at the bottom shows the distribution of smoke intensity across smoke days. (B) Responses separated out by primary ICD grouping associated with the principal visit diagnosis. Each response comes from a different regression with that group of ED visits as the outcome in Eq. 2. The all-cause response estimated from a separate regression and shown in panel A is plotted in black and reflects the net effect of positive and negative impacts associated with different diagnoses (SI Appendix, Fig. S12, for further decomposition).
