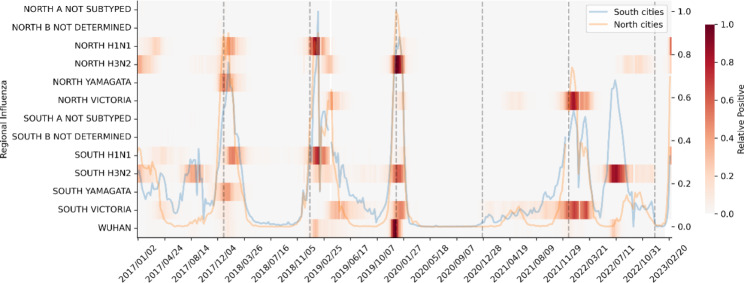
Fig. 3.
Regional and temporal distribution of influenza strains in China from 2018–2023. The heat map displays 6 types of influenza strains (H1N1, H3N2, A NOT SUBTYPED, YAMAGATA, VICTORIA, B NOT DETERMINED) in North and South China, along with influenza cases from Wuhan City. The orange and blue lines indicate North and South China, respectively, while the gray dashed lines separate each year. The y-axis represents the strains of the virus in different regions while the x-axis represents time. The dark red color represents the peak period of each strain’s outbreak during the year

