Fig. 3.
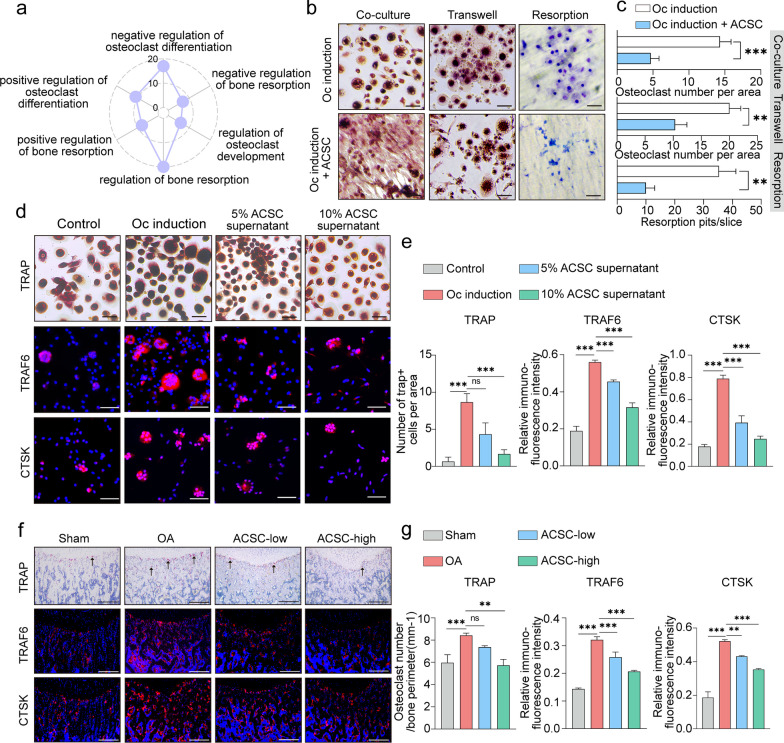
ACSCs inhibit osteoclastogenesis in vitro and in vivo. a Radar plot showing enriched osteoclast-related GO terms in ACSCs. Each axis starts at 0 and ends at 20. b TRAP staining of osteoclasts co-cultured (left) without or with ACSCs in transwell plates (middle) and toluidine blue staining for resorption pits (right) showed that ACSCs inhibit OC formation via secreted factors. Scale bars, 50 μm. c Quantification of TRAP+ multinucleated osteoclasts (> 3 nuclei) (top and middle) and resorption pits (bottom) in (b). d TRAP staining (top) and immunofluorescence staining of TRAF6 (middle) and CTSK (bottom) showed that the culture supernatant of ACSCs (5% or 10%) inhibits OC formation and OC differentiation-related gene expression. Scale bars, 50 μm. e Quantification of TRAP+ multinucleated osteoclasts (> 3 nuclei) (left) and the relative fluorescence intensity of TRAF6 (middle) and CTSK (right) in (d). f TRAP staining (top) and immunofluorescence of TRAF6 (middle) and CTSK (bottom) (genes associated with OC formation and OC differentiation) in the subchondral bone of OA rats at 4 week after injection (n = 3). Scale bars, 200 μm. g Quantification of osteoclast number (left) and the relative fluorescence intensity of TRAF6 (middle) and CTSK (right) in (f). The statistical significance of differences was determined using one-way ANOVA with multiple comparison tests (LSD). Experiments were repeated independently for more than three times. All data are shown as the mean ± S.D. **P < 0.01, ***P < 0.001; ns, not significant

