
Fig. 1.
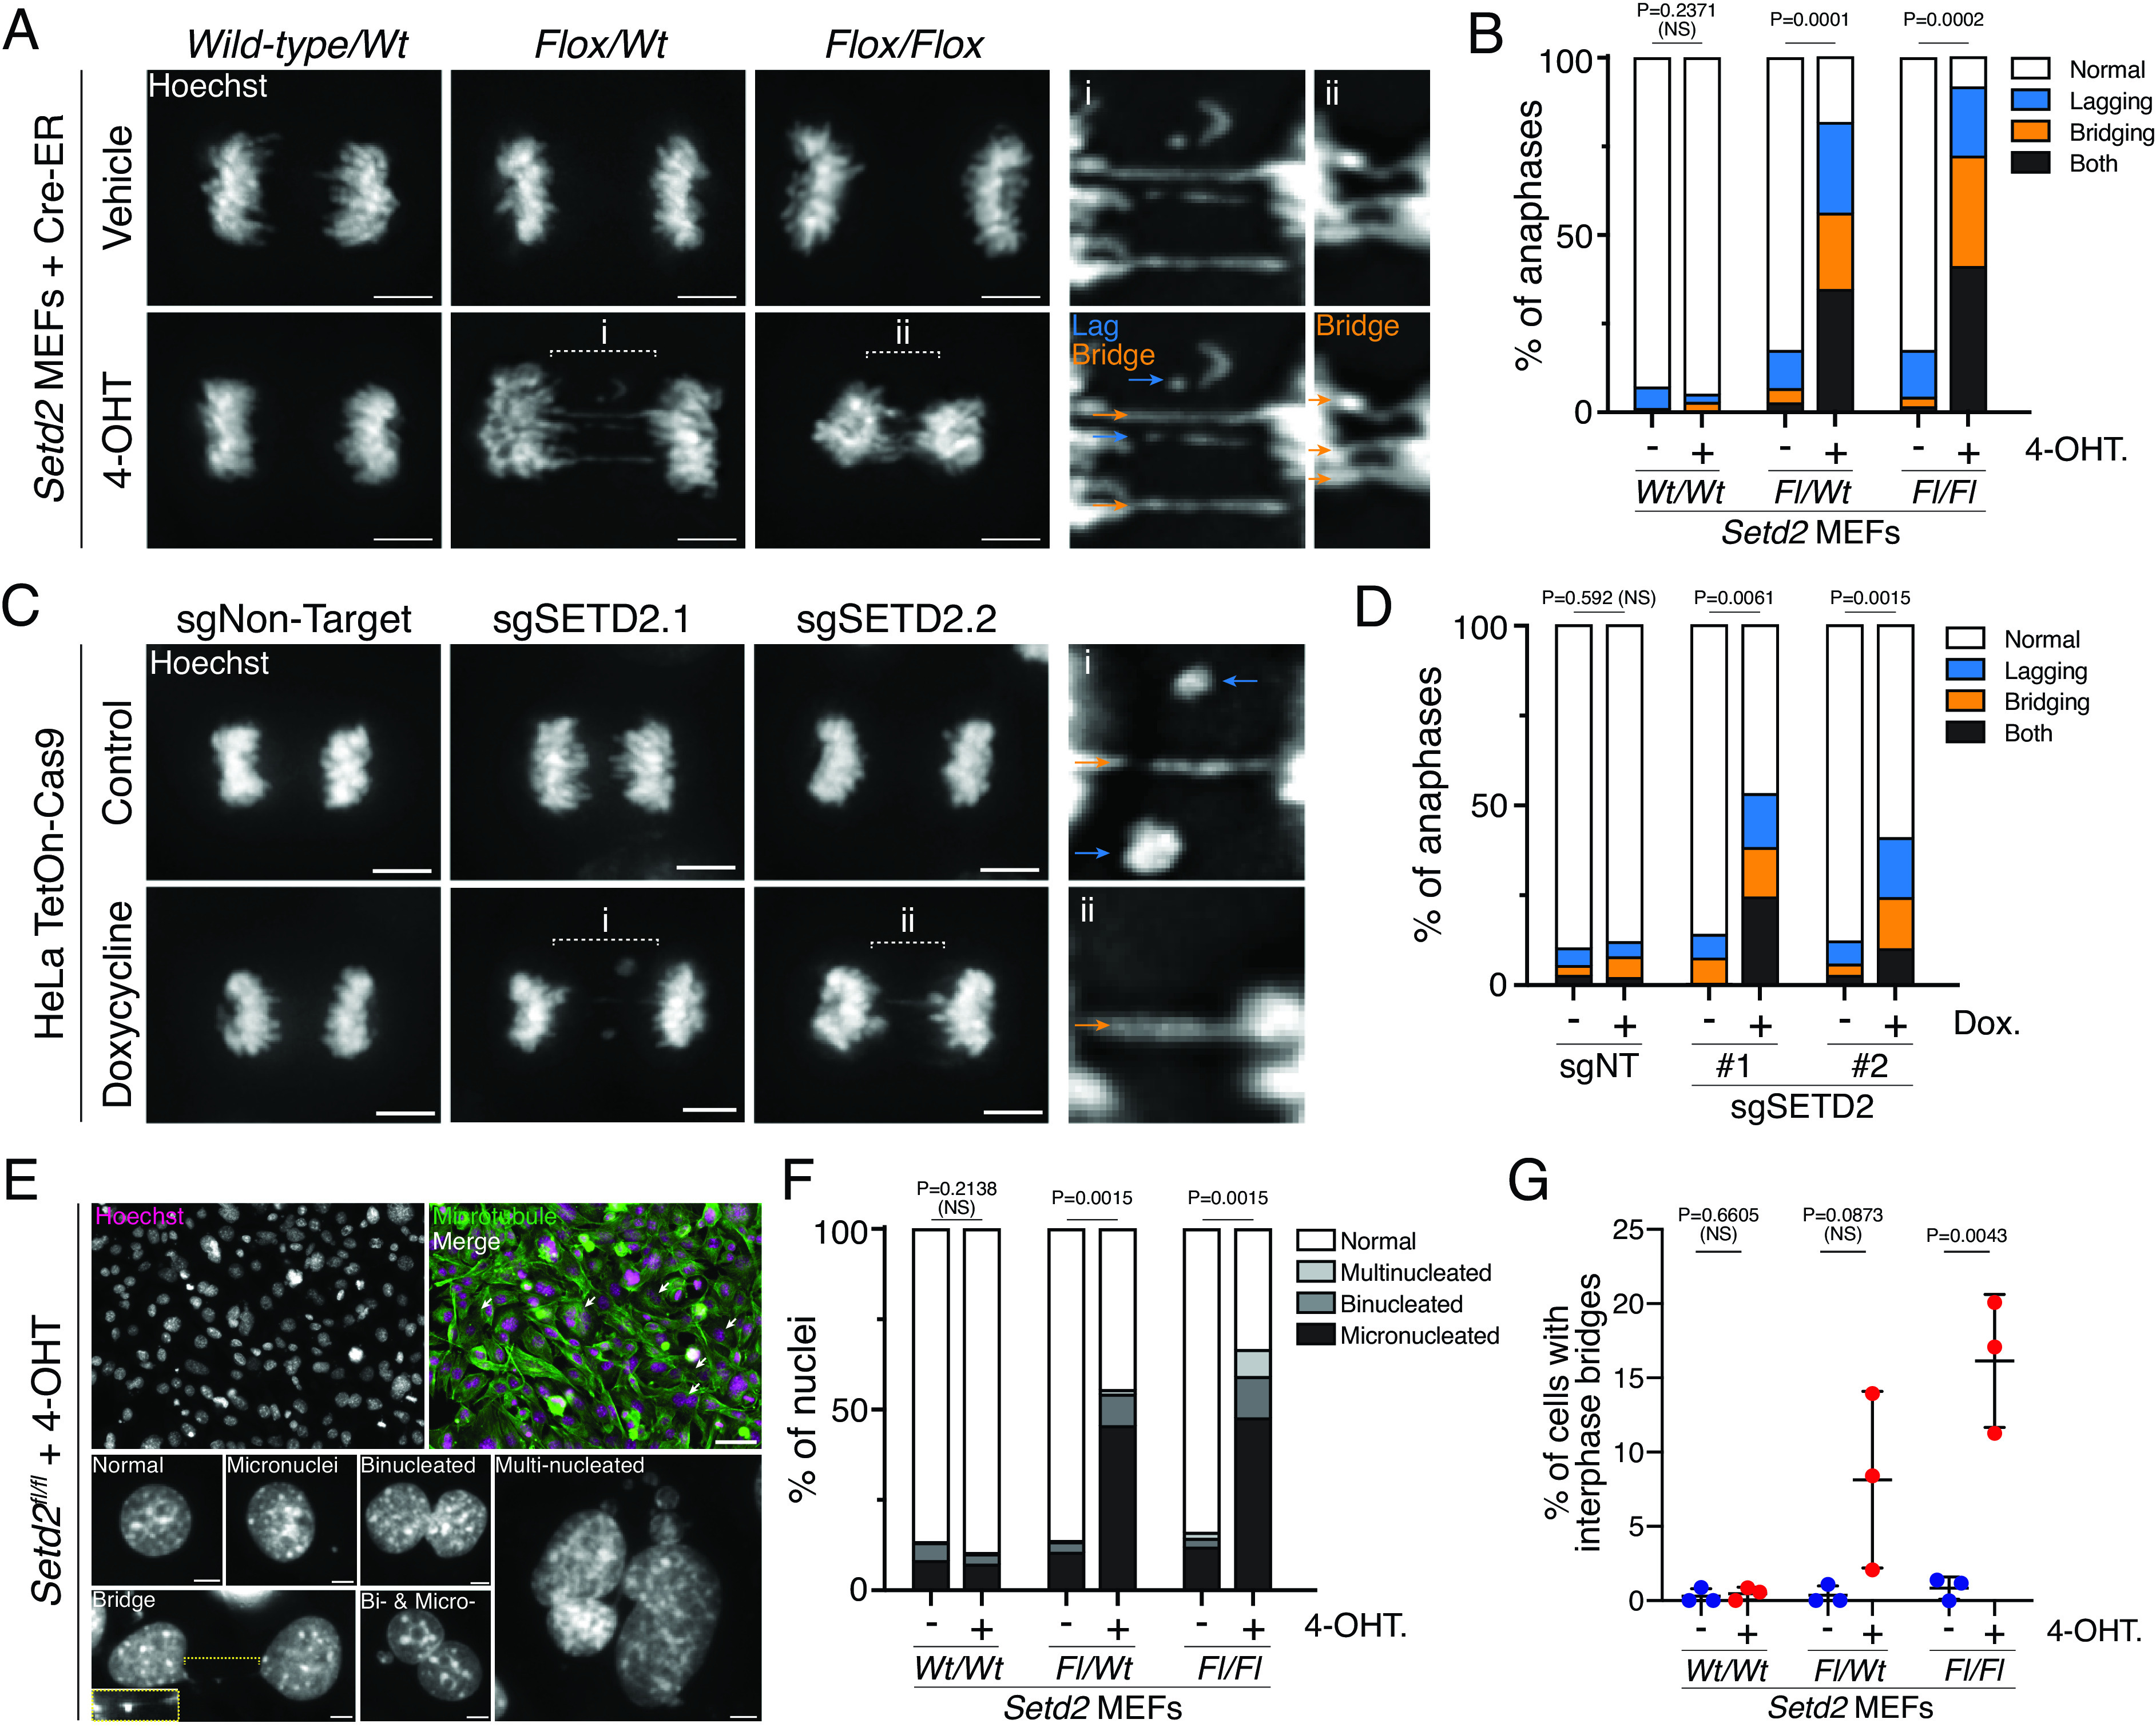
Setd2 loss causes chromatin mis-segregation during mitosis. (A) Images of wild-type, heterozygous or homozygous deletion of Setd2 have lagging (blue arrows) and bridging (orange arrows) chromosomes during the anaphase. MEFs with no, one, or two floxed alleles of Setd2 (Wild-type/WtFlox/Wt, and Flox/Flox, respectively) were either treated with vehicle (EtOH, control in top panels) or 4-OHT (excise floxed alleles of Setd2, bottom panels) for 3 d, fixed, and counterstained with Hoechst (gray). Scale bars are 5 µm. (B) Quantification of chromosome segregation errors during the anaphase and early telophase in control (vehicle-treated) or 4-OHT-treated MEFs described in (A). n = 198 wt/wt vehicle, n = 215 wt/wt 4-OHT, n = 298 fl/wt vehicle, n = 227 fl/wt 4-OHT, n = 258 fl/fl Vehicle, n = 225 fl/fl 4-OHT cells across 2 (wt/wt), 4 (fl/wt), and 3 (fl/fl) biological replicates. P values derived from an unpaired t test of normal cell values between treatment groups for each genotype. (C) Images of anaphases in control (untreated) or doxycycline-treated HeLa cells expressing tetracycline-inducible Cas9 (TetOn-Cas9) and single-guide RNA (sgRNA) that are nontargeting (NT) or specific for SETD2. Cells are counterstained with Hoechst (gray). Lagging (blue) and bridging (orange) chromosomes occur in cells lacking SETD2. Scale bars are 5 µm. (D) Quantification of chromosome segregation errors during the anaphase and early telophase in cells described in (C). n = 183 sgNT control, n = 190 sgNT dox., n = 198 sgSETD2.1 control, n = 240 sgSETD2.1 dox., n = 187 sgSETD2.2 control, n = 246 sgSETD2.2 dox. cells across three biological replicates. P values derived from an unpaired t test of normal cell values between treatment groups for each sgRNA background. (E) Image of Setd2fl/fl MEFs treated with 4-OHT (at left), showing nuclear defects that occur in interphase after 3 d treatment. Scale bars are 50 µm (top images) and 5 µm (grayscale images at the bottom). (F) Quantifications of nuclear phenotypes from images described in (E) for Setd2 MEFs. n = 450 wt/wt vehicle, n = 617 wt/wt 4-OHT, n = 650 fl/wt vehicle, n = 509 fl/wt 4-OHT, n = 736 fl/fl Vehicle, n = 687 fl/fl 4-OHT cells across three biological replicates. P values derived from an unpaired t test of normal cell values between treatment groups of each genotype. (G) Quantification of interphase bridges observed in cell images described in (E). P values derived from an unpaired t test of normal cell values between treatment groups each genotype. Error bars are SD.