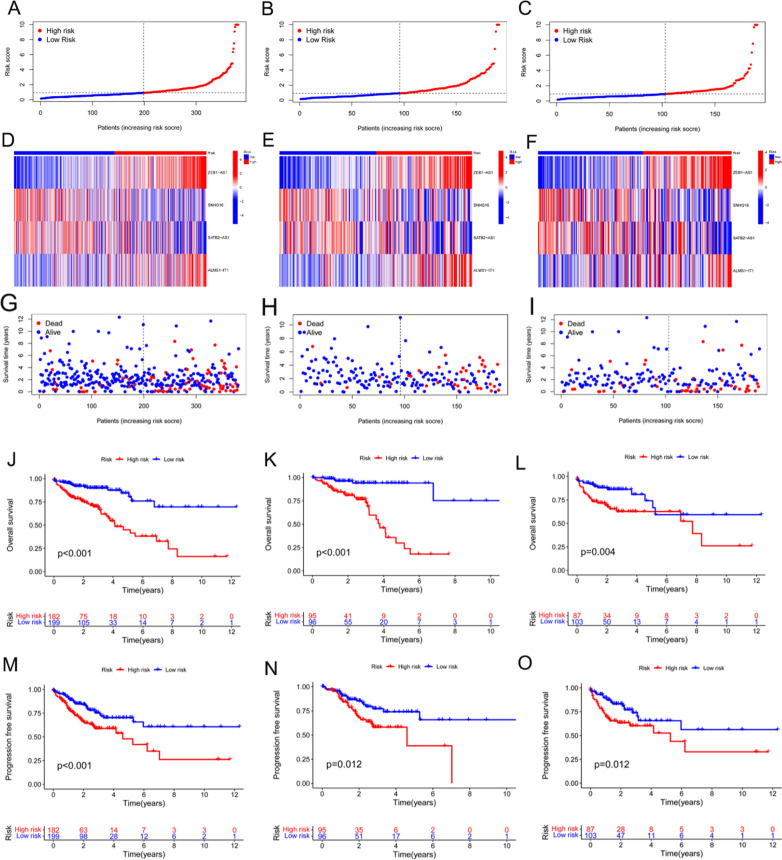
Fig. 2.
Validation of the prognostic function of the model. A The entire cohort of patients with COAD in the TCGA was divided into low- and high-risk sets based on the patients’ median risk scores. B The training group cohort of patients with COAD in the TCGA was classified into low- and high-risk sets based on the patients’ median risk scores. C The test group cohort of patients with COAD in the TCGA was grouped into low- and high-risk sets based on the patients’ median risk scores. D–F Heat maps of the expression results of the four lncRNAs between the samples from the two different risk groups in the whole, training, and test groups, respectively. G–I Life and death rate distributions of patients with COAD between the two risk groups in the whole, training, and test groups, respectively. J–L Overall survival curves corresponding to patients in the whole, training, and test groups, respectively. M–O Progression-free survival curves corresponding to patients in the whole, training, and test groups, respectively

