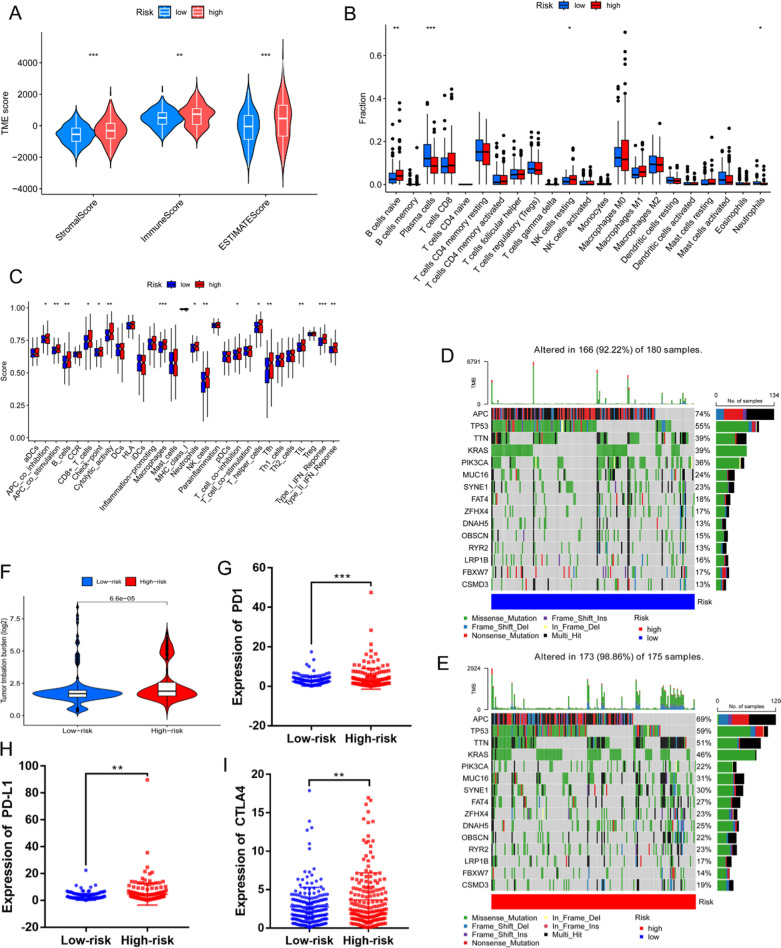
Fig. 6.
Analysis of patients’ tumor microenvironments and mutations. A Violin plot comparing the stromal, immune, and ESTIMATE scores between the high- and low-risk sets separately (ESTIMATE scores = stromal scores + immune scores). B Different immunocyte infiltration percentages. C ssGSEA scores for 16 immunocytes and 13 immune functions. D, E Waterfall plot of somatic mutations in the low- and high-risk groups. F Comparison of the TMB differences between the two risk groups. G–I Relative expression of PD1, PD-L1, and CTLA4 in the two risk groups (*p < 0.05, **p < 0.01, ***p < 0.001)

