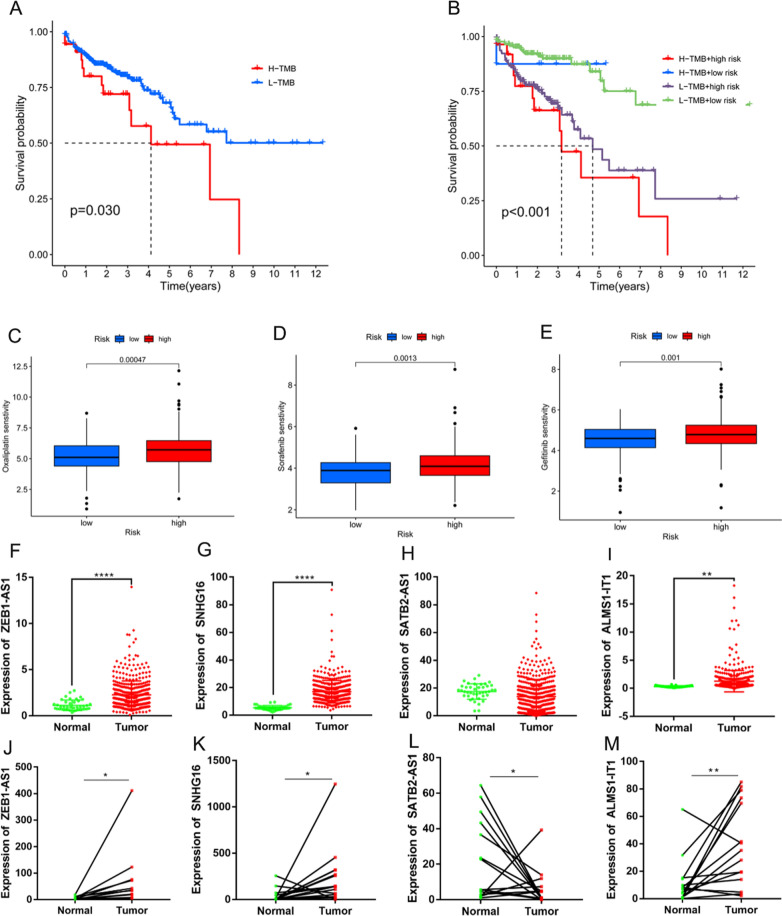
Fig. 7.
Validation of the model. A Survival analysis of two groups with high and low TMBs. B Survival analysis of two risk groups and two TMB groups. C–E Sensitivity comparisons of commonly used front-line chemotherapeutic agents between two groups. F–I Relative expression levels of ZEB1-AS1, SNHG16, SATB2-AS1, and ALMS1-IT1 in cancer and paracancerous samples from patients with COAD in the TCGA, respectively. Relative expression levels of ZEB1-AS1, SNHG16, SATB2-AS1, and ALMS1-IT1 in cancer and paracancerous samples from patients with COAD in the TCGA, respectively. J–M Relative expression levels of ZEB1-AS1, SNHG16, SATB2-AS1, and ALMS1-IT1 in COAD and paired non-cancerous tissue samples, respectively, from the Affiliated Hospital of Qingdao University (*p < 0.05, **p < 0.01, ***p < 0.001, ****p < 0.0001)

