Fig. 1.
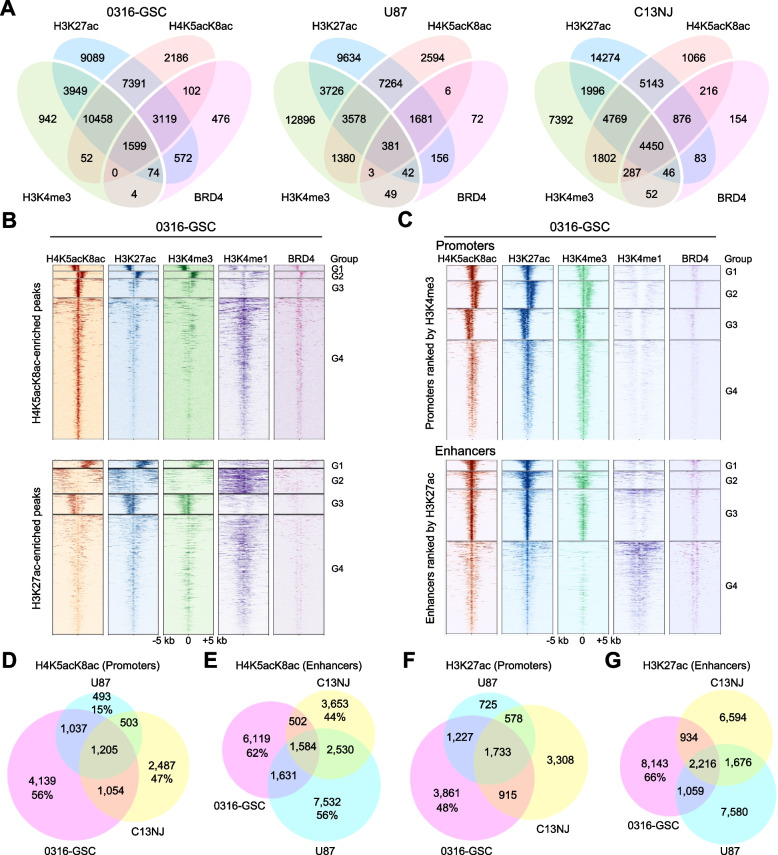
Enrichment of H4K5acK8ac at promoters and enhancers across glial cell lines. A Venn diagrams showing overlap of ChIP-seq peaks of H4K5acK8ac with a known enhancer mark (H3K27ac), a known promoter mark (H3K4me3), and BRD4 in 0316-GSC, U87, and C13NJ cell lines. In 0316-GSC cells, 90% of H4K5acK8ac-enriched peaks intersected with 65% of H3K27ac and 46% of H4K5acK8ac with 74% of H3K4me3. B and C Heatmaps representing different ChIP-seq datasets (H4K5acK8ac, H3K27ac, H3K4me3, H3K4me1, and BRD4) in 0316-GSC cells. Data are from within ± 5-kb from the summit of H4K5acK8ac-enriched peaks (upper, B) and H3K27ac-enriched peaks (lower, B), and promoters defined by H3K4me3 at the promoters (upper, C) and enhancers defined by H3K27ac located outside a promoter (lower, C). Each row represents a single peak. Color density indicates the average enrichment of each mark at the selected regions. H4K5acK8ac- or H3K27ac-enriched peaks and promoters or enhancers are each clustered into four groups (G1 to G4) according to the ChIP-seq profiles. D–G Venn diagrams showing overlap of ChIP-seq peaks at promoters and enhancers. H4K5acK8ac-enriched promoters (D) and enhancers (E), and H3K27ac-enriched promoters (F) and enhancers (G) intersect across the three cell lines

