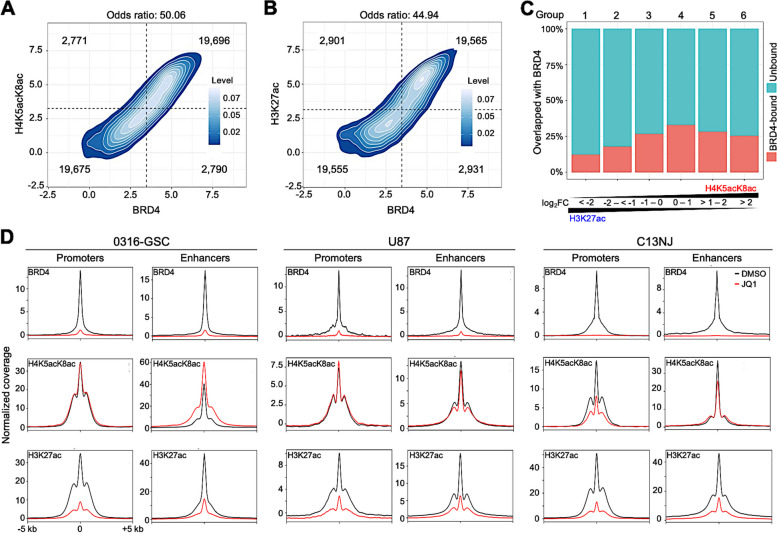
Fig. 2.
Effect of JQ1 on H4K5acK8ac-enriched regulatory regions across glial cell lines. A and B Density plots showing the association between the normalized ChIP-seq signal of BRD4 binding and H4K5acK8ac (A) and H3K27ac (B) binding. Based on the signals, the regions were categorized into four groups (separated by dotted lines); the number representing weak and strong categories of compared marks in each group is given. A higher odds ratio of binding means a higher association. A Fisher exact test was used to test whether the odds ratio was equal to 1. C Colocalization of BRD4 with acetylated peaks. The percentages of BRD4 ChIP-seq peaks (y-axis) that cover H4K5acK8ac- or H3K27ac-enriched peaks (x-axis) in 0316-GSC cells are shown: red bars, BRD4-bound; blue bars, BRD-unbound; FC, relative ChIP-seq signal of H4K5acK8ac over H3K27ac. D Effects of JQ1 on the enrichment of BRD4 (top), H4K5acK8ac (middle), and H3K27ac (bottom) at promoters and enhancers. ChIP-seq meta-profiles for dimethylsulfoxide (DMSO) (black) and JQ1-treated (red) cells represent the average read counts at reads per million (RPM) of ± 5-kb regions from the summit of BRD4-, H4K5acK8ac-, and H3K27ac-enrichment at promoters and enhancers

