Fig. 5.
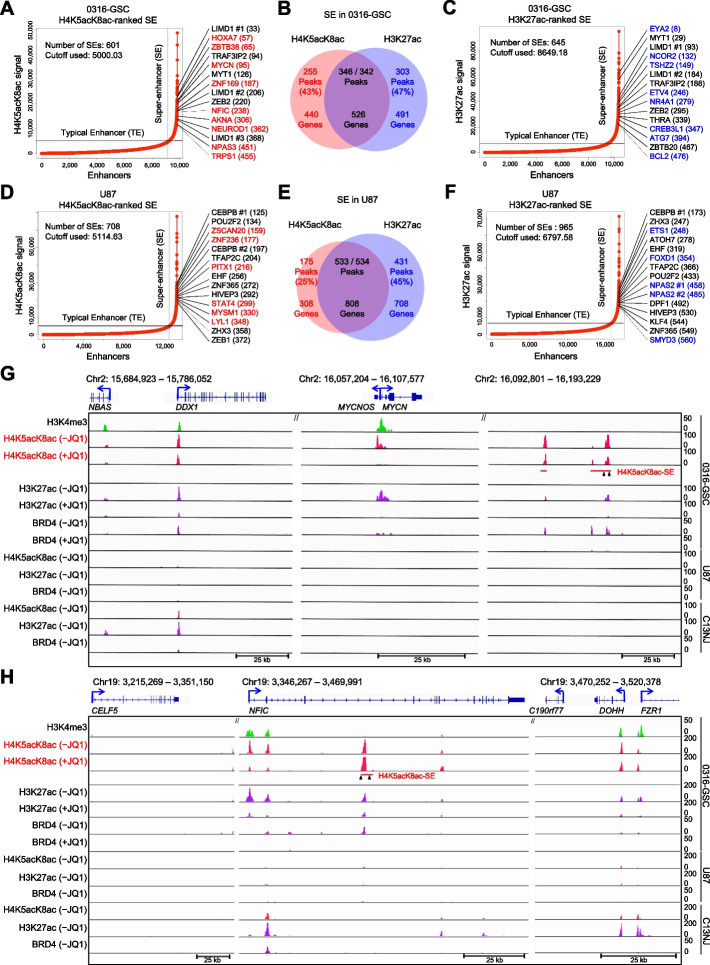
Defining super-enhancers by H4K5acK8ac enrichment ranking. Enhancers in 0316-GSC (A–C) and U87 (D–F) cells were ranked by H4K5acK8ac or H3K27ac signal level by using the ROSE algorithm; those with extremely high signals were defined as super-enhancers (SEs) (see Methods for threshold calculations). JQ1-downregulated transcription factor candidate genes with H4K5acK8ac- (red) or H3K27ac-preferred (blue) SEs are shown. Venn diagrams show the number of peaks and associated genes with H4K5acK8ac- or H3K27ac-preferred SEs or both (the intersection, purple) for each cell line. G and H Representative ChIP-seq occupancy tracks of genes with H4K5acK8ac-preferred SEs (MYCN and NFIC) in 0316-GSC, U87, and C13NJ cells. Arrowheads under the SE bar show the position for CRISPR-Cas9–mediated deletion of the SE region. ChIP-seq reads were averaged from two biological replicates

