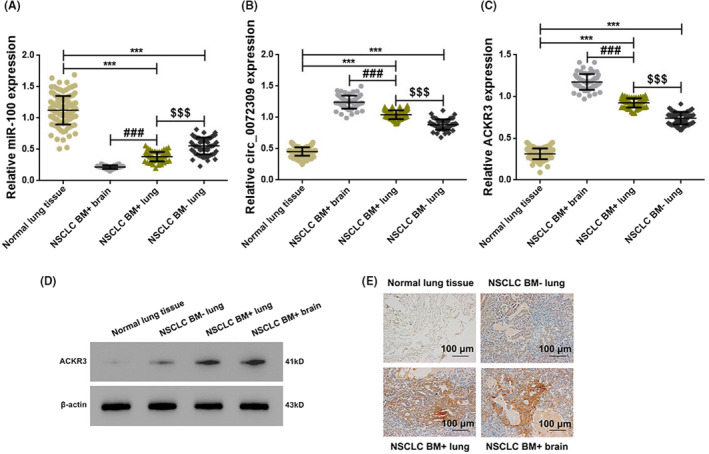
FIGURE 1.

Up‐regulation of hsa_circ_0072309 and ACKR3, and down‐regulation of miR‐100 in brain metastases of NSCLC patients. Graphs showing the relative RNA expression of hsa_circ_0072309 (A), ACKR3 (B), and miR‐100 (C) in clinical tissue specimens from NSCLC patients as detected by qPCR. *** versus Normal lung tissues, p < 0.001; ### versus NSCLC BM+ lung tissues, p < 0.001; $$$ versus NSCLC BM− lung tissues, p < 0.001. (D) Representative Western blot showing the expression of ACKR3 in clinical tissue specimens. (E) Immunohistochemistry staining of ACKR3 in clinical tissue specimens with brown stains indicating positivity (scale bar:100 μm; magnification: ×200).
