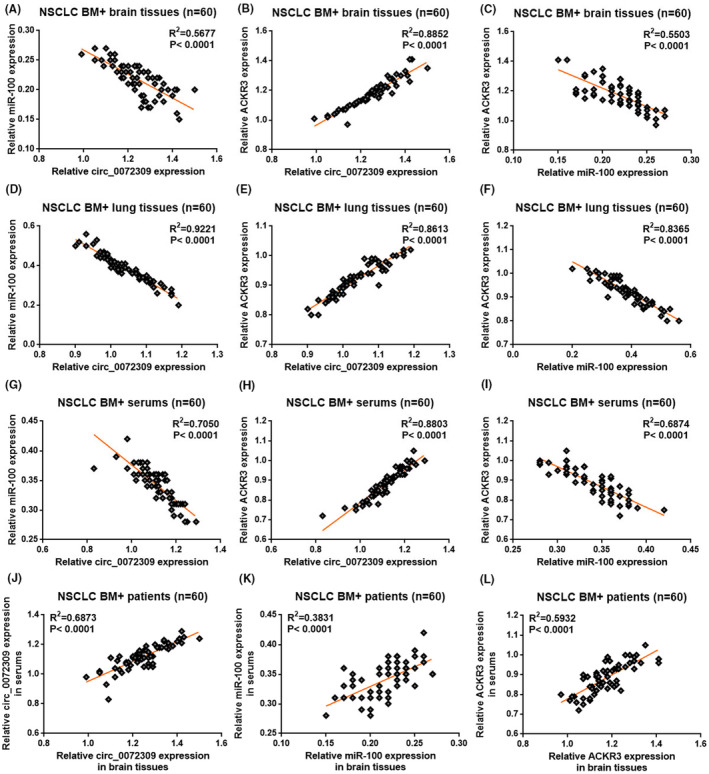
FIGURE 3.

Differential correlations between hsa_circ_0072309, ACKR3, and miR‐100 in NSCLC patients with BM. Graphs showing the Pearson correlation between expressions of hsa_circ_0072309 and ACKR3 (A), hsa_circ_0072309 and miR‐100 (B), miR‐100 and ACKR3 (C) in the brain tissues of BM+ patients. Graphs showing the Pearson correlation between expressions of hsa_circ_0072309 and ACKR3 (D), hsa_circ_0072309 and miR‐100 (E), miR‐100 and ACKR3 (F) in the lung tissues of BM+ patients. Graphs showing the Pearson correlation between expressions of hsa_circ_0072309 and ACKR3 (G), hsa_circ_0072309 and miR‐100 (H), miR‐100 and ACKR3 (I) in the serums of BM+ patients. Graphs showing the Pearson correlation between brain tissue and serum expression of hsa_circ_0072309 (J), ACKR3 (K), miR‐100 (L).
