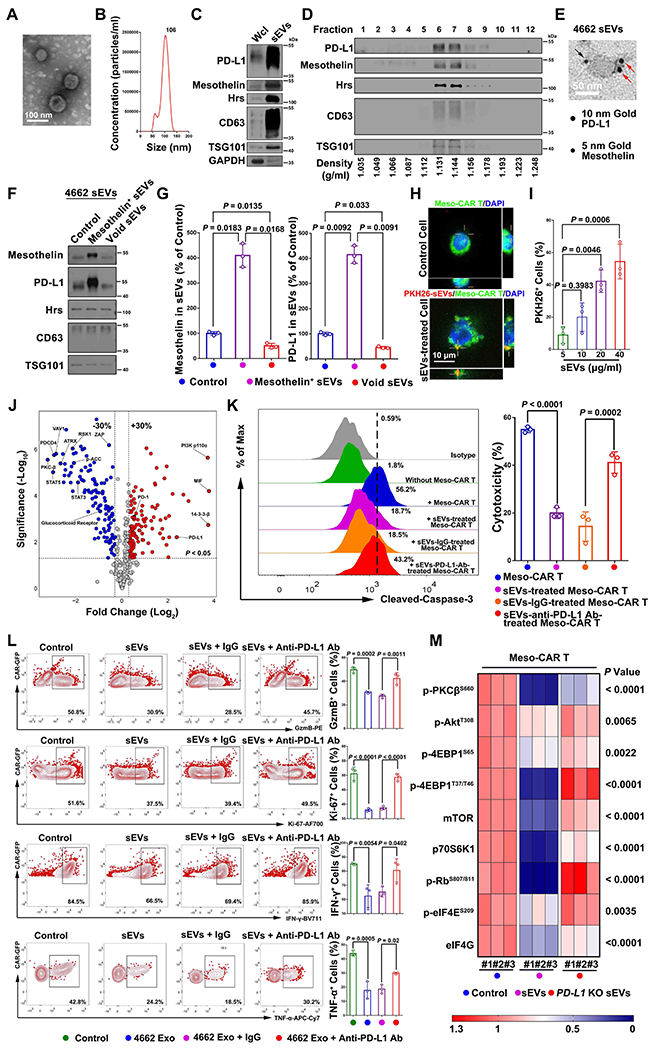
Figure 2. PDAC cell-derived sEVs inhibit Meso CAR T cells.

A, A representative EM image of purified sEVs from 4662 cells. Scale bar, 100 nm. B, Nanoparticle tracking analysis of sEVs purified from 4662 cells. The X-axis represents the diameters of the particles, and the Y-axis represents the concentration (particles/ml) of the sEVs. C, Western blot analysis of PD-L1, mesothelin and exosome marker proteins (Hrs, CD63 and TSG101) in the whole cell lysate (“Wcl”) and purified sEVs from 4662 cells. All lanes were loaded with an equal amount of proteins. D, PD-L1 and mesothelin co-fractionated with exosome marker proteins (Hrs, CD63 and TSG101) on iodixanol density gradients for 4662 cell-derived sEVs. E, A representative immuno-EM image of 4662 cell-derived sEV co-stained with anti-PD-L1 antibodies (conjugated with 10 nm gold particles, indicated by the red arrows) and anti-mesothelin antibodies (conjugated with 5 nm gold particles, indicated by the black arrows). Scale bar, 50 nm. F, Co-enrichment of PD-L1 on mesothelin+ sEVs. Proteins on mesothelin+ sEVs isolated by magnetic beads and the remaining sEVs (“Void sEVs”) were analyzed by western blotting. An equal amount of sEV proteins from the different fractions was loaded. G, Quantification of sEV mesothelin (left) and PD-L1 (right) expression in 4662 cell-derived sEVs. H, Confocal microscopy imaging showing the association of Meso-CAR T cells (green) with 4662 cell-derived sEVs labeled with PKH26 (red). Nuclei were stained with DAPI (blue). The interaction of sEVs on Meso-CAR T cells was indicated by crosses. Scale bar, 10 μm. I, The percentages of sEV-bound Meso-CAR T cells. Different amounts of sEVs were used in the binding assay. J, Volcano plot of RPPA data displaying the pattern of protein expression comparing Meso-CAR T cells with or without tumor sEVs treatment. Dotted vertical lines represent expression differences of 30%. Dotted horizontal lines represent a significance level of P < 0.05. K, Meso-CAR T cells treated with PBS, 4662 cell-derived sEVs with or without IgG isotype or PD-L1 antibody blocking, were co-cultured with 4662 cells for 48 hrs. Apoptosis of 4662 cells was assayed by flow cytometry using cleaved caspase-3. The relative cytotoxicity is shown to the right. L, Representative flow cytometric images of Meso-CAR T cells examined for the expression of GzmB, Ki-67, interferon gamma (IFN-γ) and tumor necrosis factor-α (TNF-α) after indicated treatments. Quantification of cells with GzmB, Ki-67, IFN-γ and TNF-α expression in Meso-CAR T cells after indicated treatments is shown to the right. M, Heatmap showing the expression levels of the representative proteins in Meso-CAR T cells with or with indicated sEVs treatment. Data represent mean ± s.d. (n=3). Statistical analysis is performed using one-way ANOVA analysis with Dunnett’s multiple comparison tests (G), two-sided unpaired multiple t-test (J), Welch ANOVA with Sidak’s T3 multiple comparison tests (I, K, L) or two-way ANOVA analysis with Tukey’s multiple comparison tests (M).
