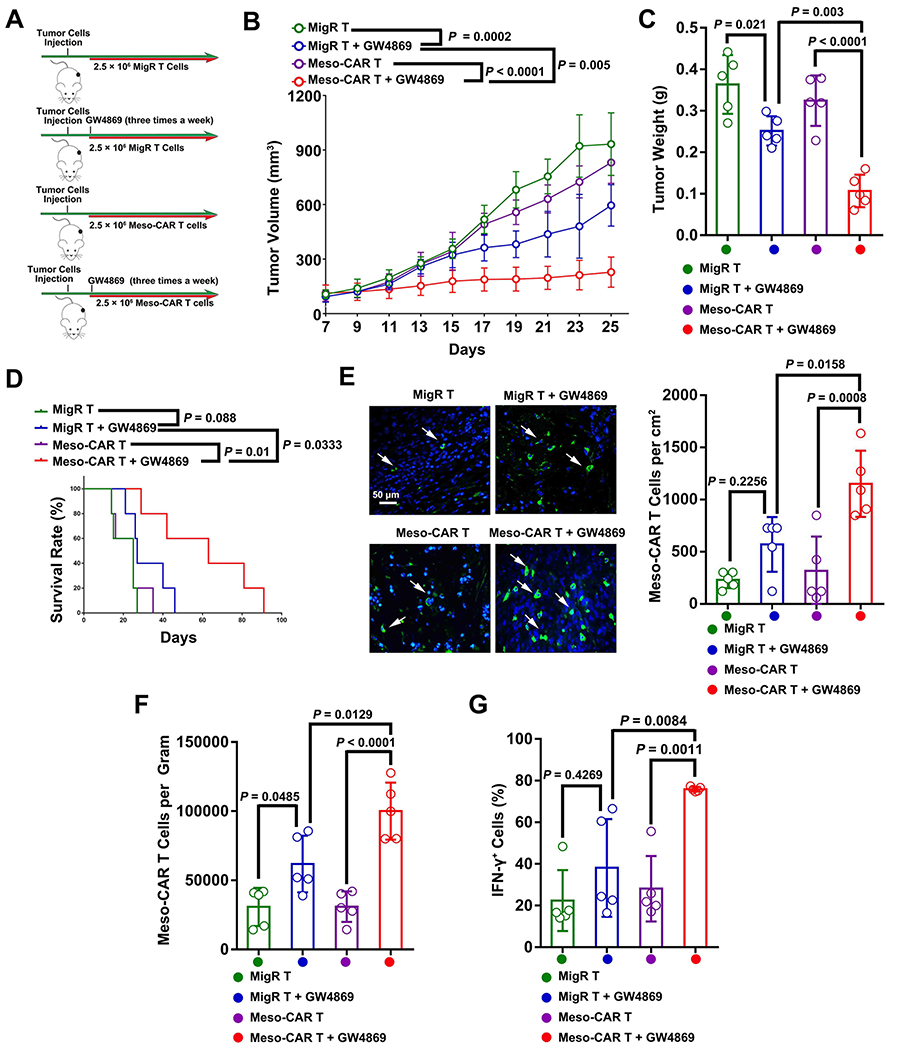
Figure 6. GW4869 boosted the CAR T therapy in mouse PDAC model.

A, Schema of C57BL/6 mice with 4662 tumors were treated with MigR or Meso-CAR T cells with or without GW4869. See Materials and Methods for details. B, Growth curves of tumors in mice with indicated treatments. C, Tumor weights with indicated treatments. D, Survival rates of mice with indicated treatments. E, Representative IHC images of Meso-CAR T cells (green) in tumor tissues. Nuclei were stained with DAPI (blue). Scale bar, 50 μm. The number of Meso-CAR T cells for each group of mice quantified from IHC analysis is shown to the right. F, The number of Meso-CAR T cells in tumors for each group of mice quantified based on flow cytometry analysis. G, The percentage of IFN-γ+ Meso-CAR T cells quantified by flow cytometry. Data represent mean ± s.d. (n=5). Statistical analysis is performed using Welch ANOVA with Dunnett’s T3 multiple comparison tests (B, C, E-G) or log-rank test (D).
