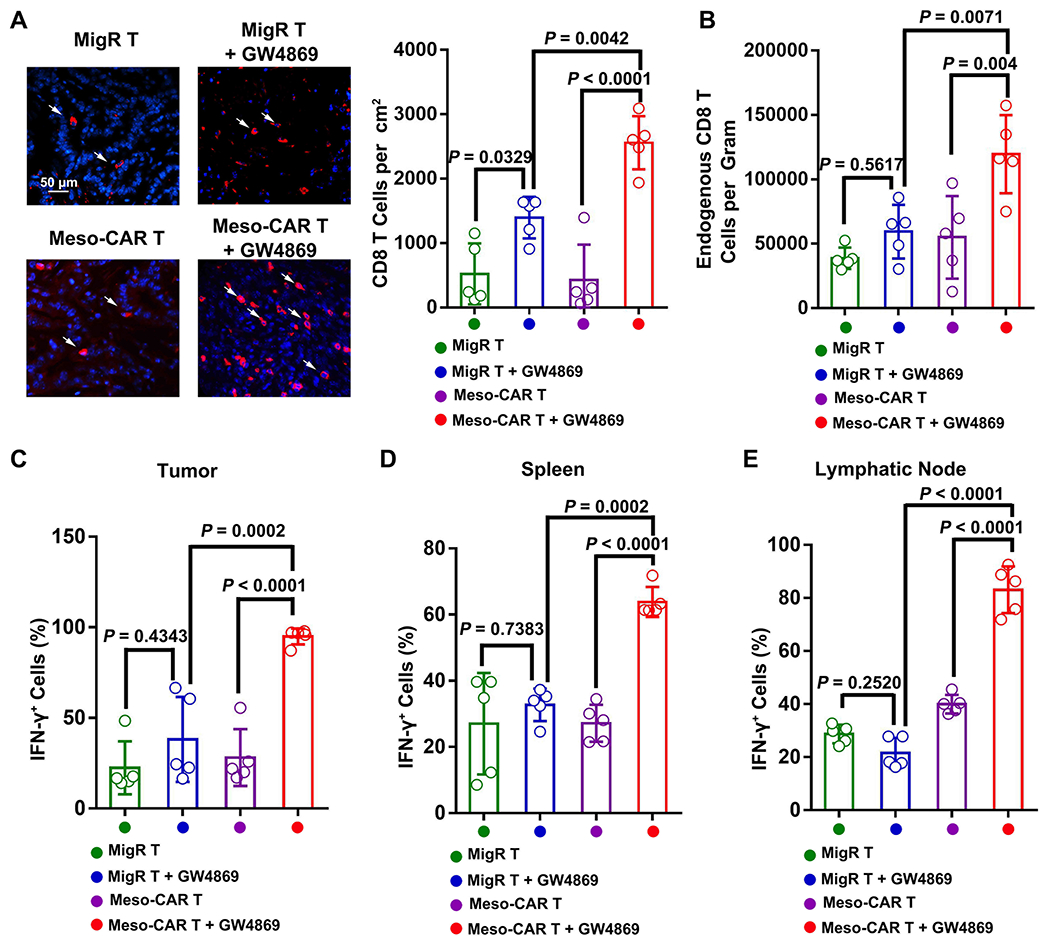
Figure 7. The combination of Meso-CAR T cells and GW4869 enhanced the activation of endogenous CD8 T cells in immunocompetent mice.

A, Representative immunofluorescence images of endogenous CD8 T cells in tumor tissues. Scale bar, 50 μm. The number of CD8 cells for each group of mice quantified from immunofluorescence analysis is shown at the right. B, The number of CD8 T cells in tumors for each group of mice quantified from flow cytometry analysis. C-E, The percentage of IFN-γ+ CD8 T cells in tumors (C), spleen (D), and lymphatic nodes (E) quantified from flow cytometry. Data represent mean ± s.d. (n=5). Statistical analysis is performed using Welch ANOVA with Dunnett’s T3 multiple comparison tests (A-E).
