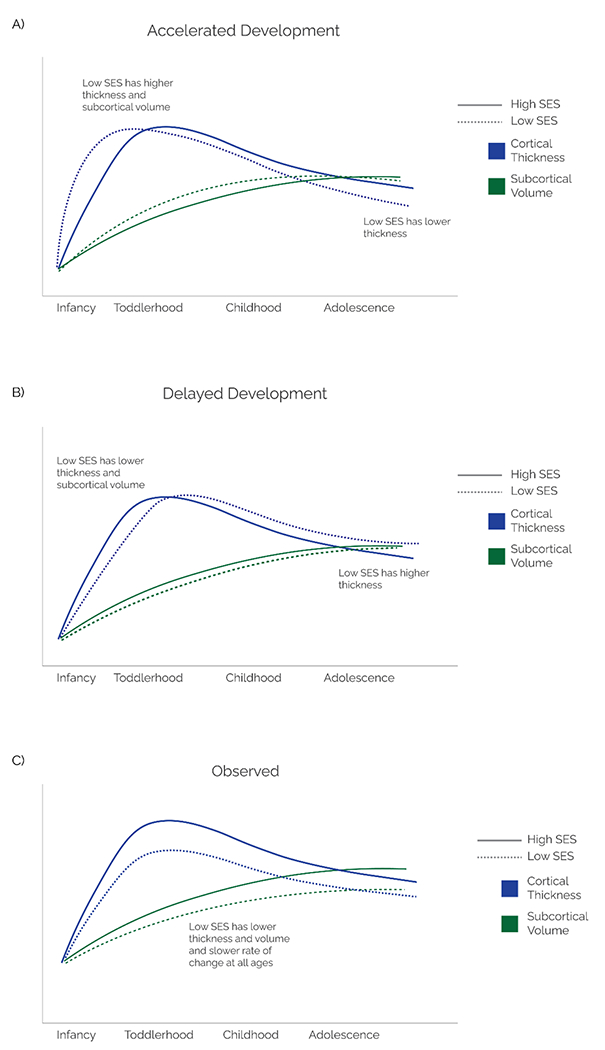
Figure 1: SES and the pace of neurodevelopment: theoretical predictions and empirical observations.

Expected trajectories of cortical thickness from infancy to late adolescence based on models of accelerated (A) and delayed (B) brain development Solid and dashed lines represent trajectories for high and low-SES youth, respectively. Panel C depicts the patterns observed in existing longitudinal studies. These patterns suggest that low-SES children have consistently lower cortical thickness, volume, surface area, and subcortical volume as well as slower rates of change during both growth and decline. Figures depict the starting point for low- and high-SES infants to coincide as evidence on SES-related differences in brain volume at birth is limited. Blue and green lines represent average trajectories for cortical thickness and subcortical volume—specifically amygdala and hippocampus, respectively.
