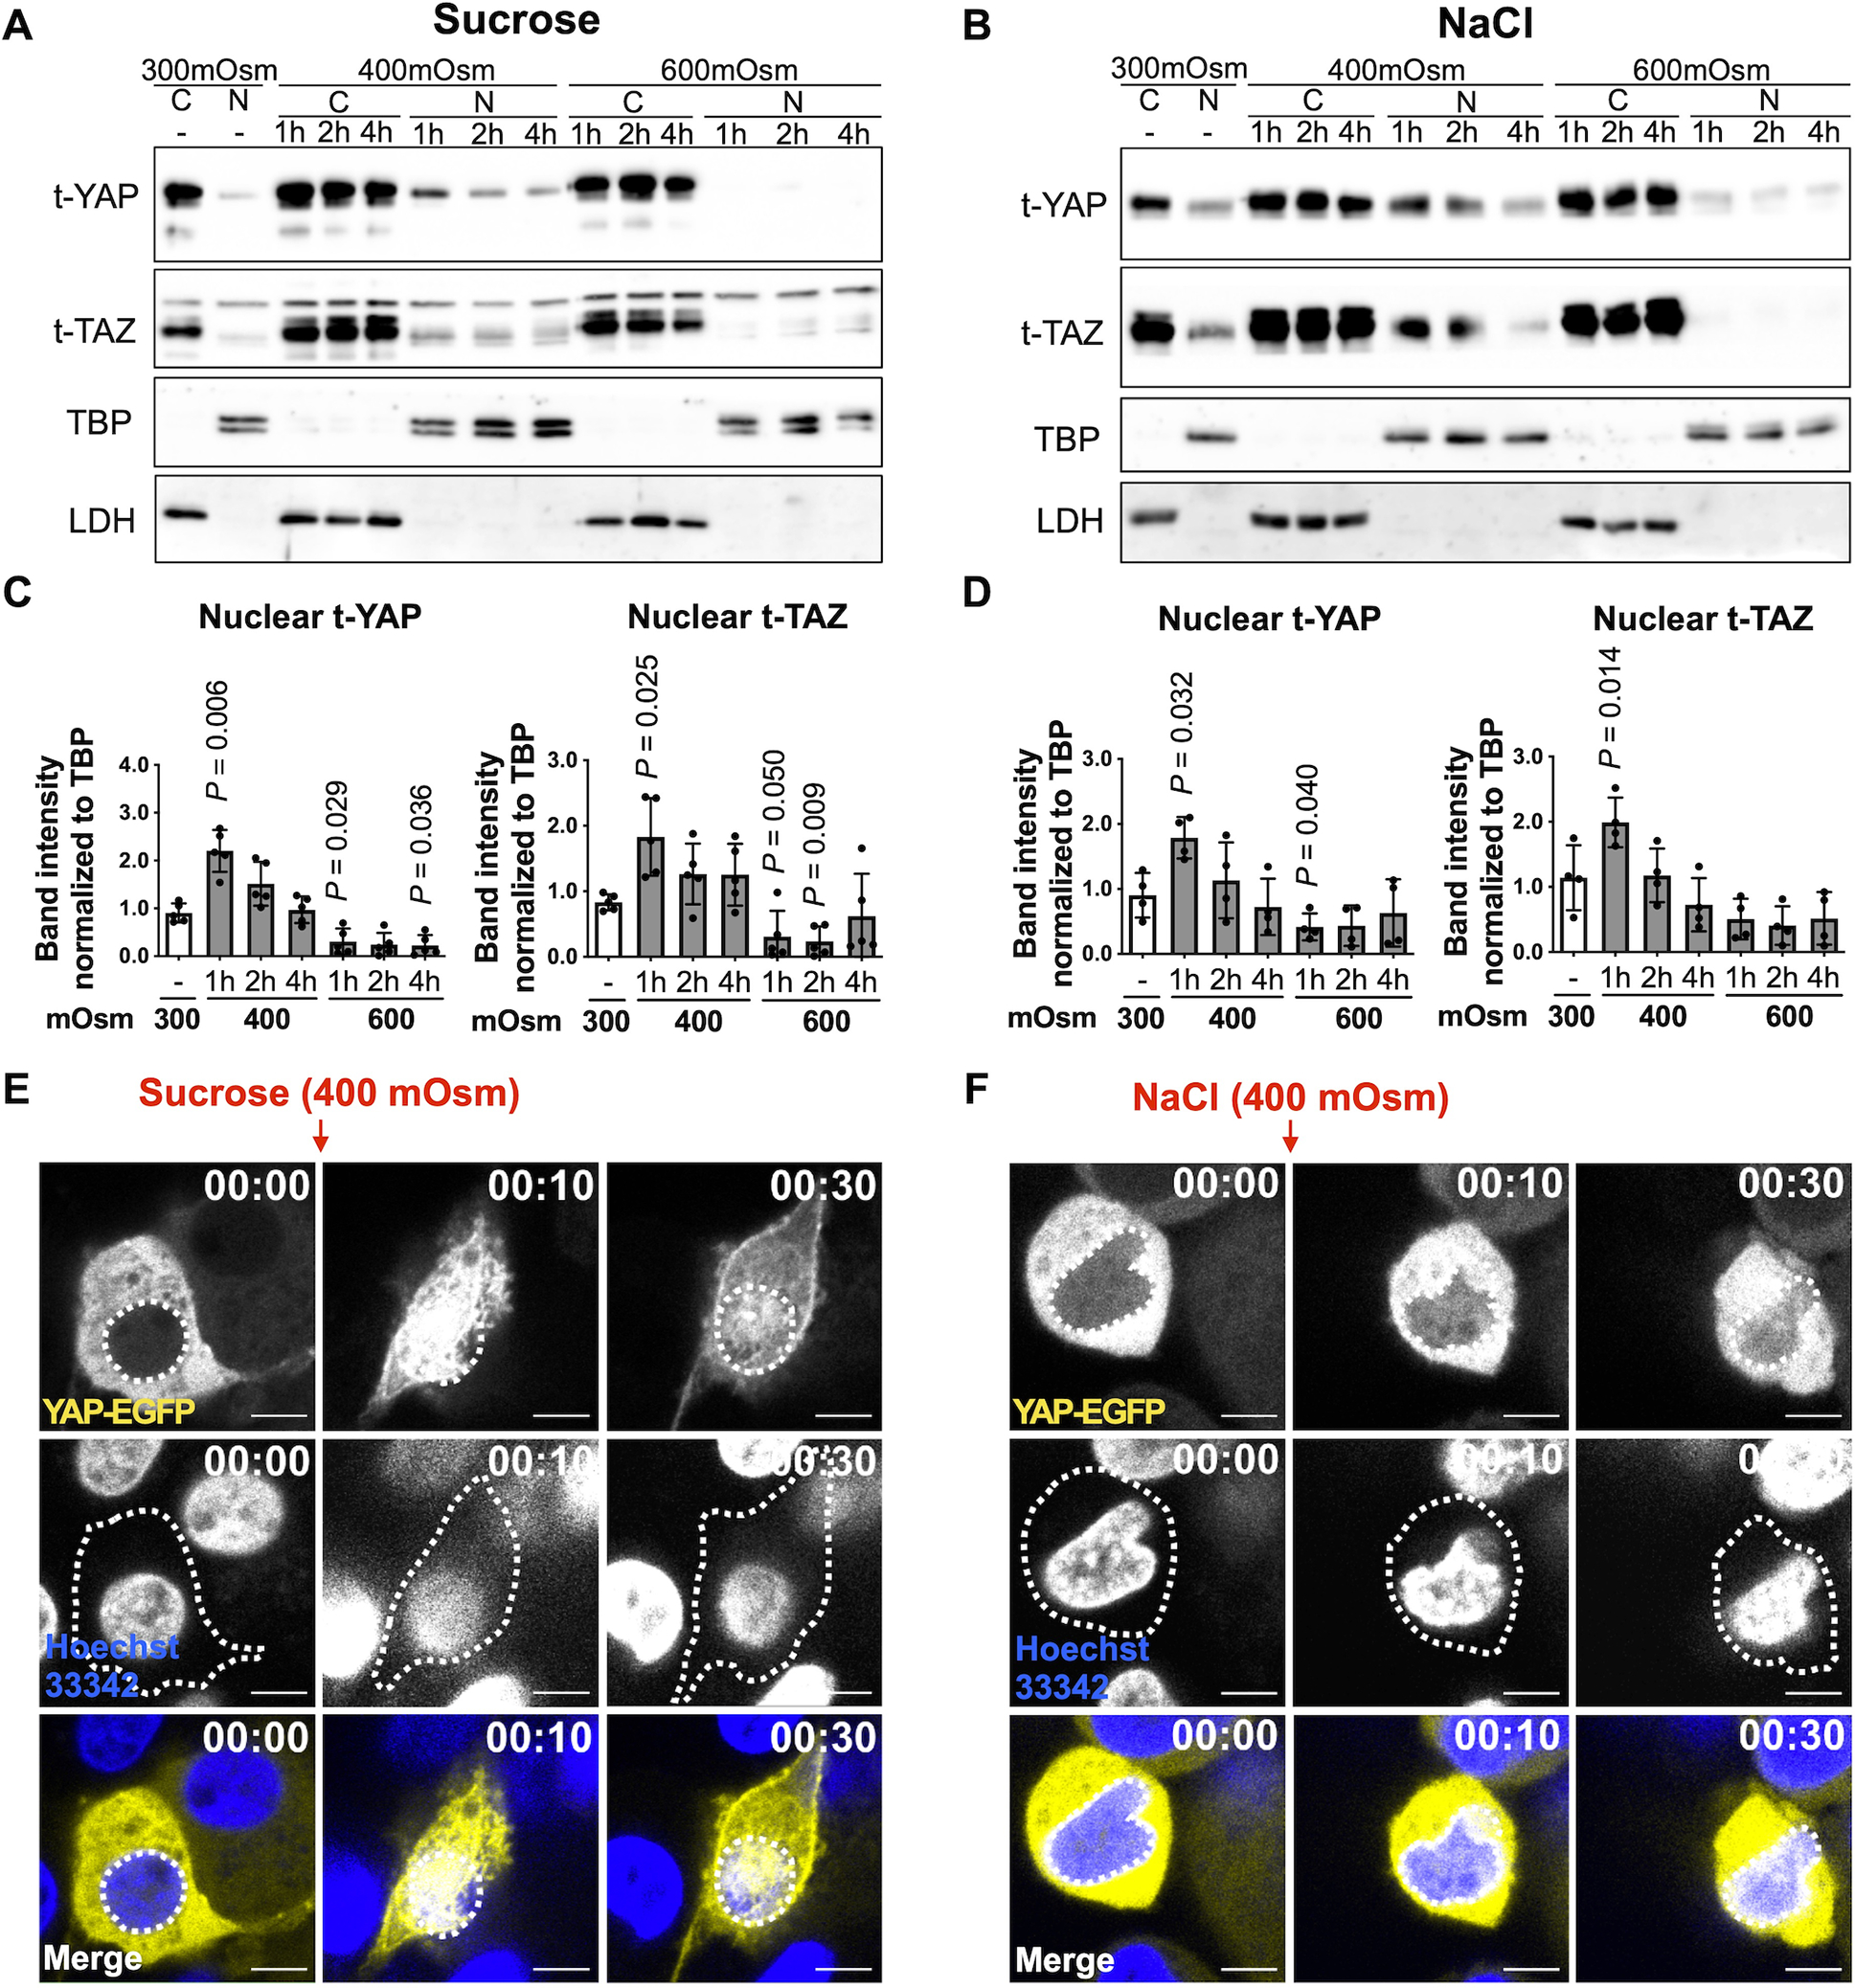
Fig. 1. YAP/TAZ nuclear translocation in response to osmotic stimulation.

(A, B) Human chondrocytes were incubated for 1–4 hrs in standard iso-osmotic 300 milliosmole (mOsm) media, 400 mOsm media, or 600 mOsm media produced using sucrose or NaCl. Cytosolic and nuclear fractions were prepared from cell lysates and immunoblotted for total YAP and TAZ. LDH and TBP served as loading controls for cytosolic and nuclear fractions, respectively. (A) Representative immunoblots from n = 5 independent donors under sucrose-induced osmotic stimulation and (B) representative immunoblots from n = 4 independent donors under NaCl-induced osmotic stimulation (t, total; SE, short exposure; LE, long exposure). (C, D) Densitometric analysis of immunoblots. The relative band intensities of nuclear YAP (n =5 independent donors) and TAZ (n = 4 independent donors) were normalized to the loading control TBP and are presented as the mean ± standard deviation; indicated p-values were determined by paired t-tests used to compare different conditions to 300 mOsm controls. The values for Figure 1C (YAP) were logarithmically transformed to achieve normality. (E, F) Human chondrocytes expressing YAP-EGFP were incubated in 400 mOsm media produced using sucrose or NaCl and subjected to live-cell imaging using confocal microscopy over 1hr. Nuclei were detected with Hoechst 33342 (blue staining). The top row shows representative images of YAP-EGFP, and white dotted lines indicate the contour of the nucleus. The middle row shows representative images of the nucleus, and white dotted lines indicate the contour of corresponding chondrocytes. Representative live-cell imaging for merged images (Hoechst 33342 and YAP-EGFP) are presented in the bottom row. White dotted lines indicate the contour of the nucleus. Scale bar, 5 μm.
