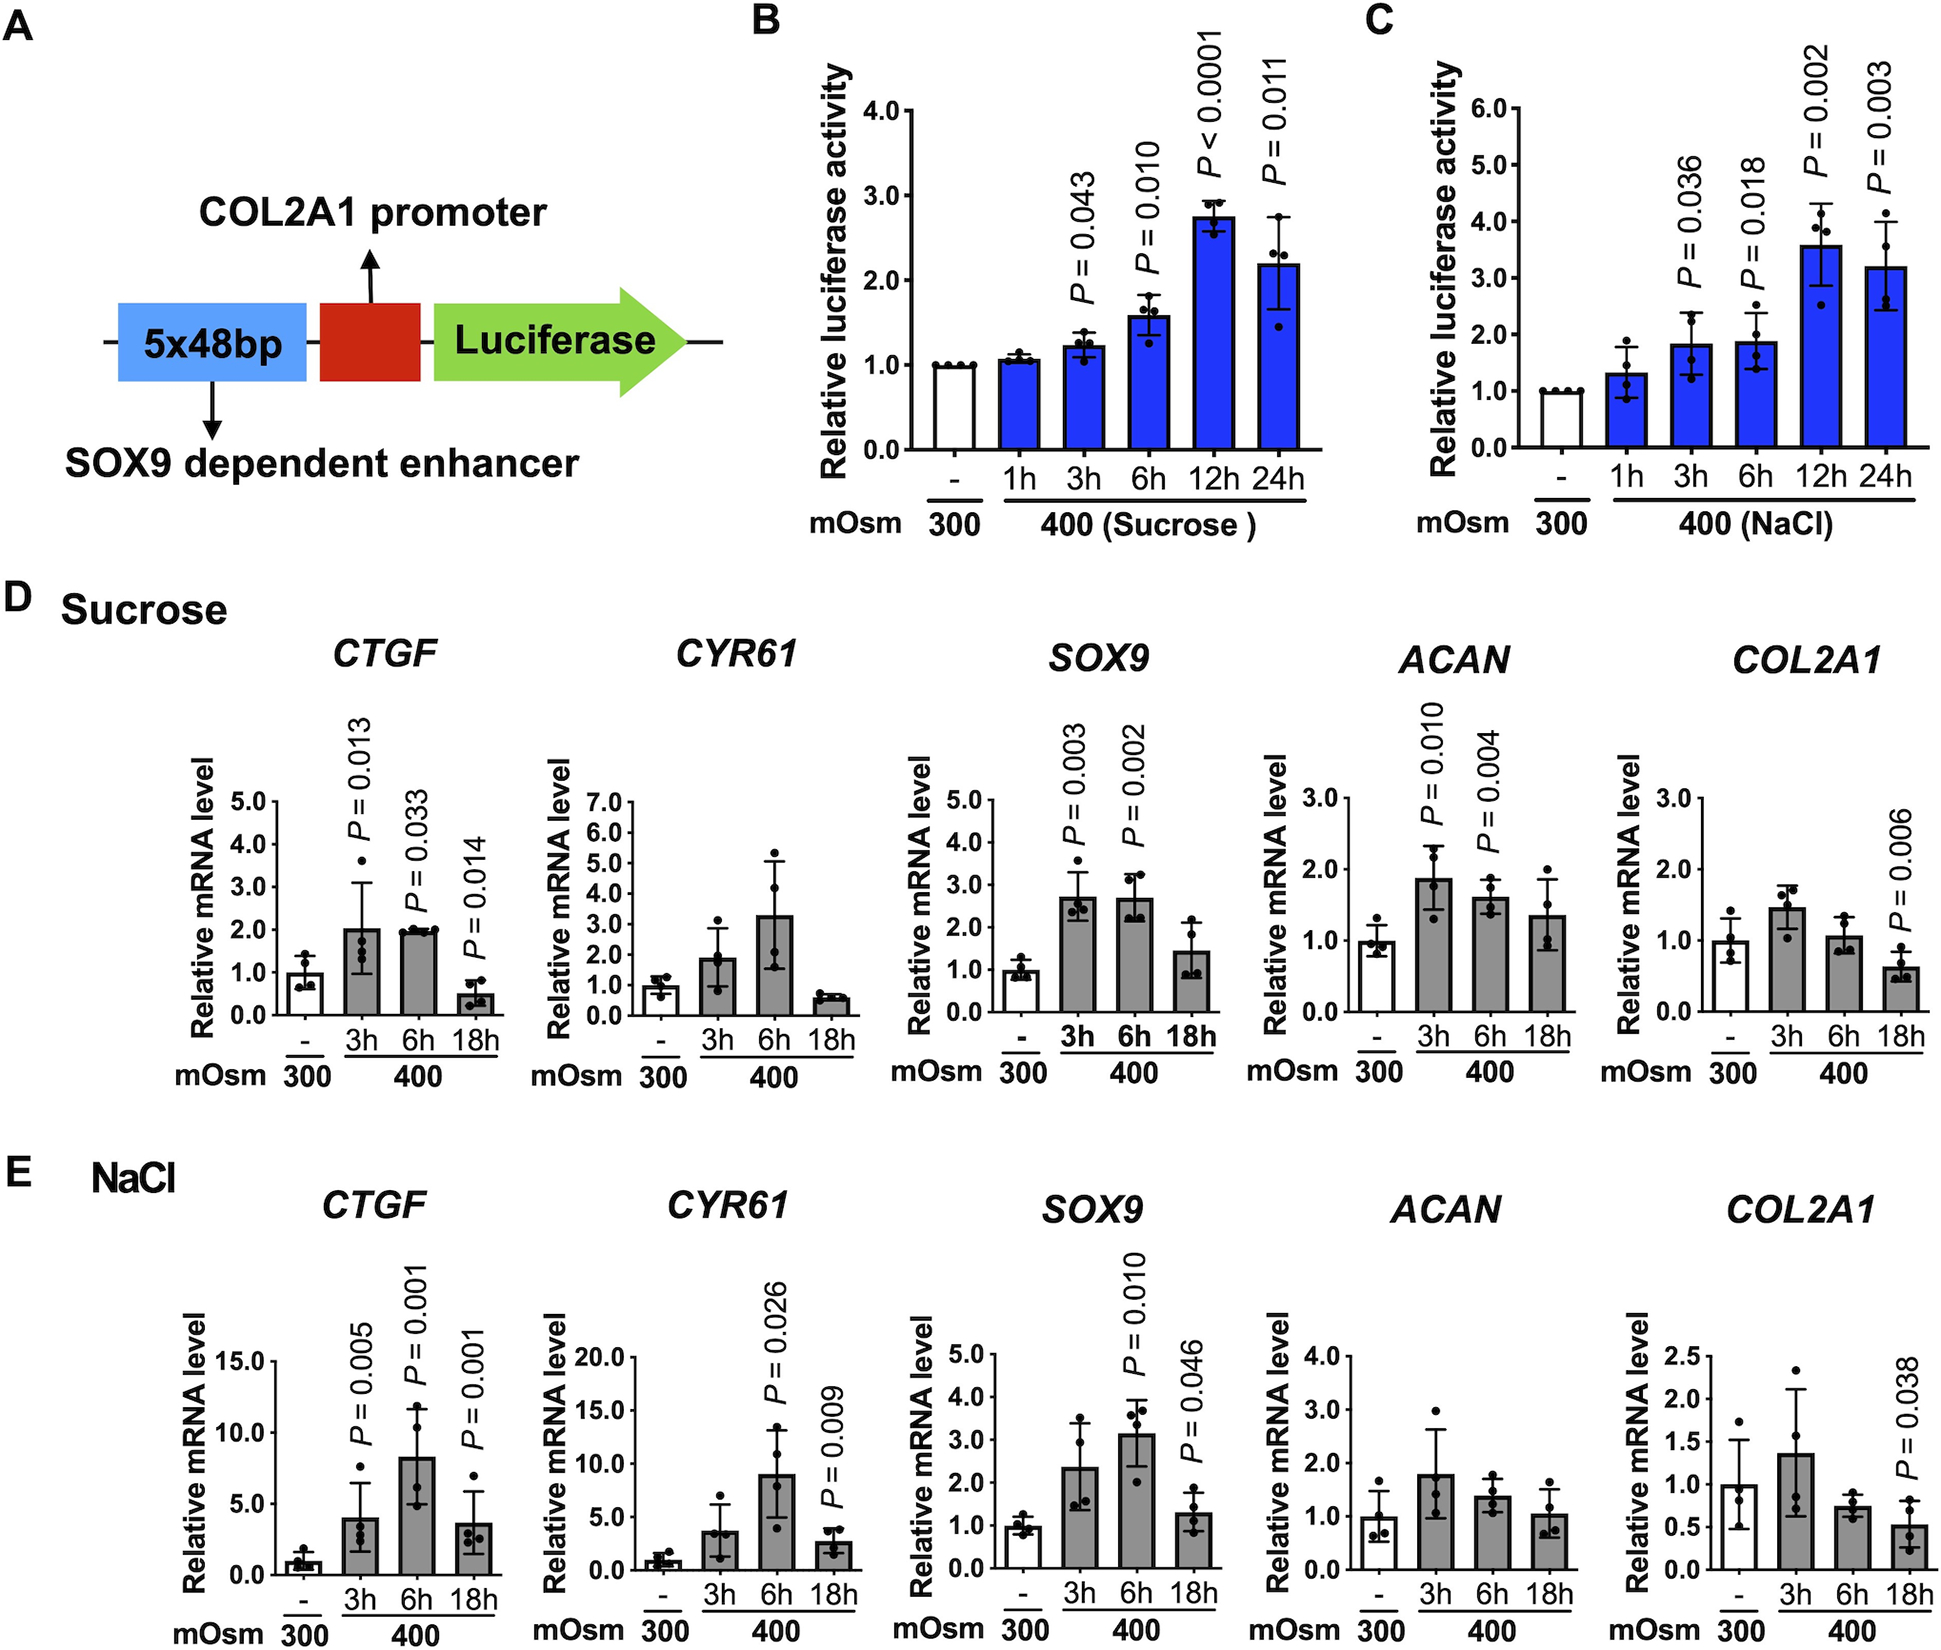
Fig. 2. Anabolic gene expression in response to osmotic stimulation.

(A) Schematic of the SOX9-dependent COL2A1 enhancer-luciferase reporter construct. The 5 tandem copies of 48 bp enhancer elements (blue box) and the COL2A1 promoter (red box) are indicated. (B, C) Chondrocytes were transiently transfected with the SOX9-dependent COL2A1 reporter construct for 48 hr, followed by incubation in standard 300 mOsm media or 400 mOsm media produced using sucrose or NaCl for the indicated times, and then the luciferase activity was measured. The data are expressed as fold changes relative to 300 mOsm controls. (n = 4 independent donors). For each condition, one-sample t-test was applied to compare logged 2 transformed fold change to zero, which corresponds to the fold change of 1 indicating no difference. (D, E) Chondrocytes were incubated in 300 mOsm or 400 mOsm media for 3 hr, 6 hr and 18 hr. Expression of CTGF, CYR61, SOX9, ACAN and COL2A1 mRNA was normalized to TBP. Data are presented as the mean ± standard deviation. (n = 4 independent donors); indicated p-values were determined by paired t-tests used to compare different conditions to 300 mOsm controls. The values for Figure 2D (CTGF, ACAN), 2E (CTFF, SOX9, COL2A1) were logarithmically transformed to achieve normality.
