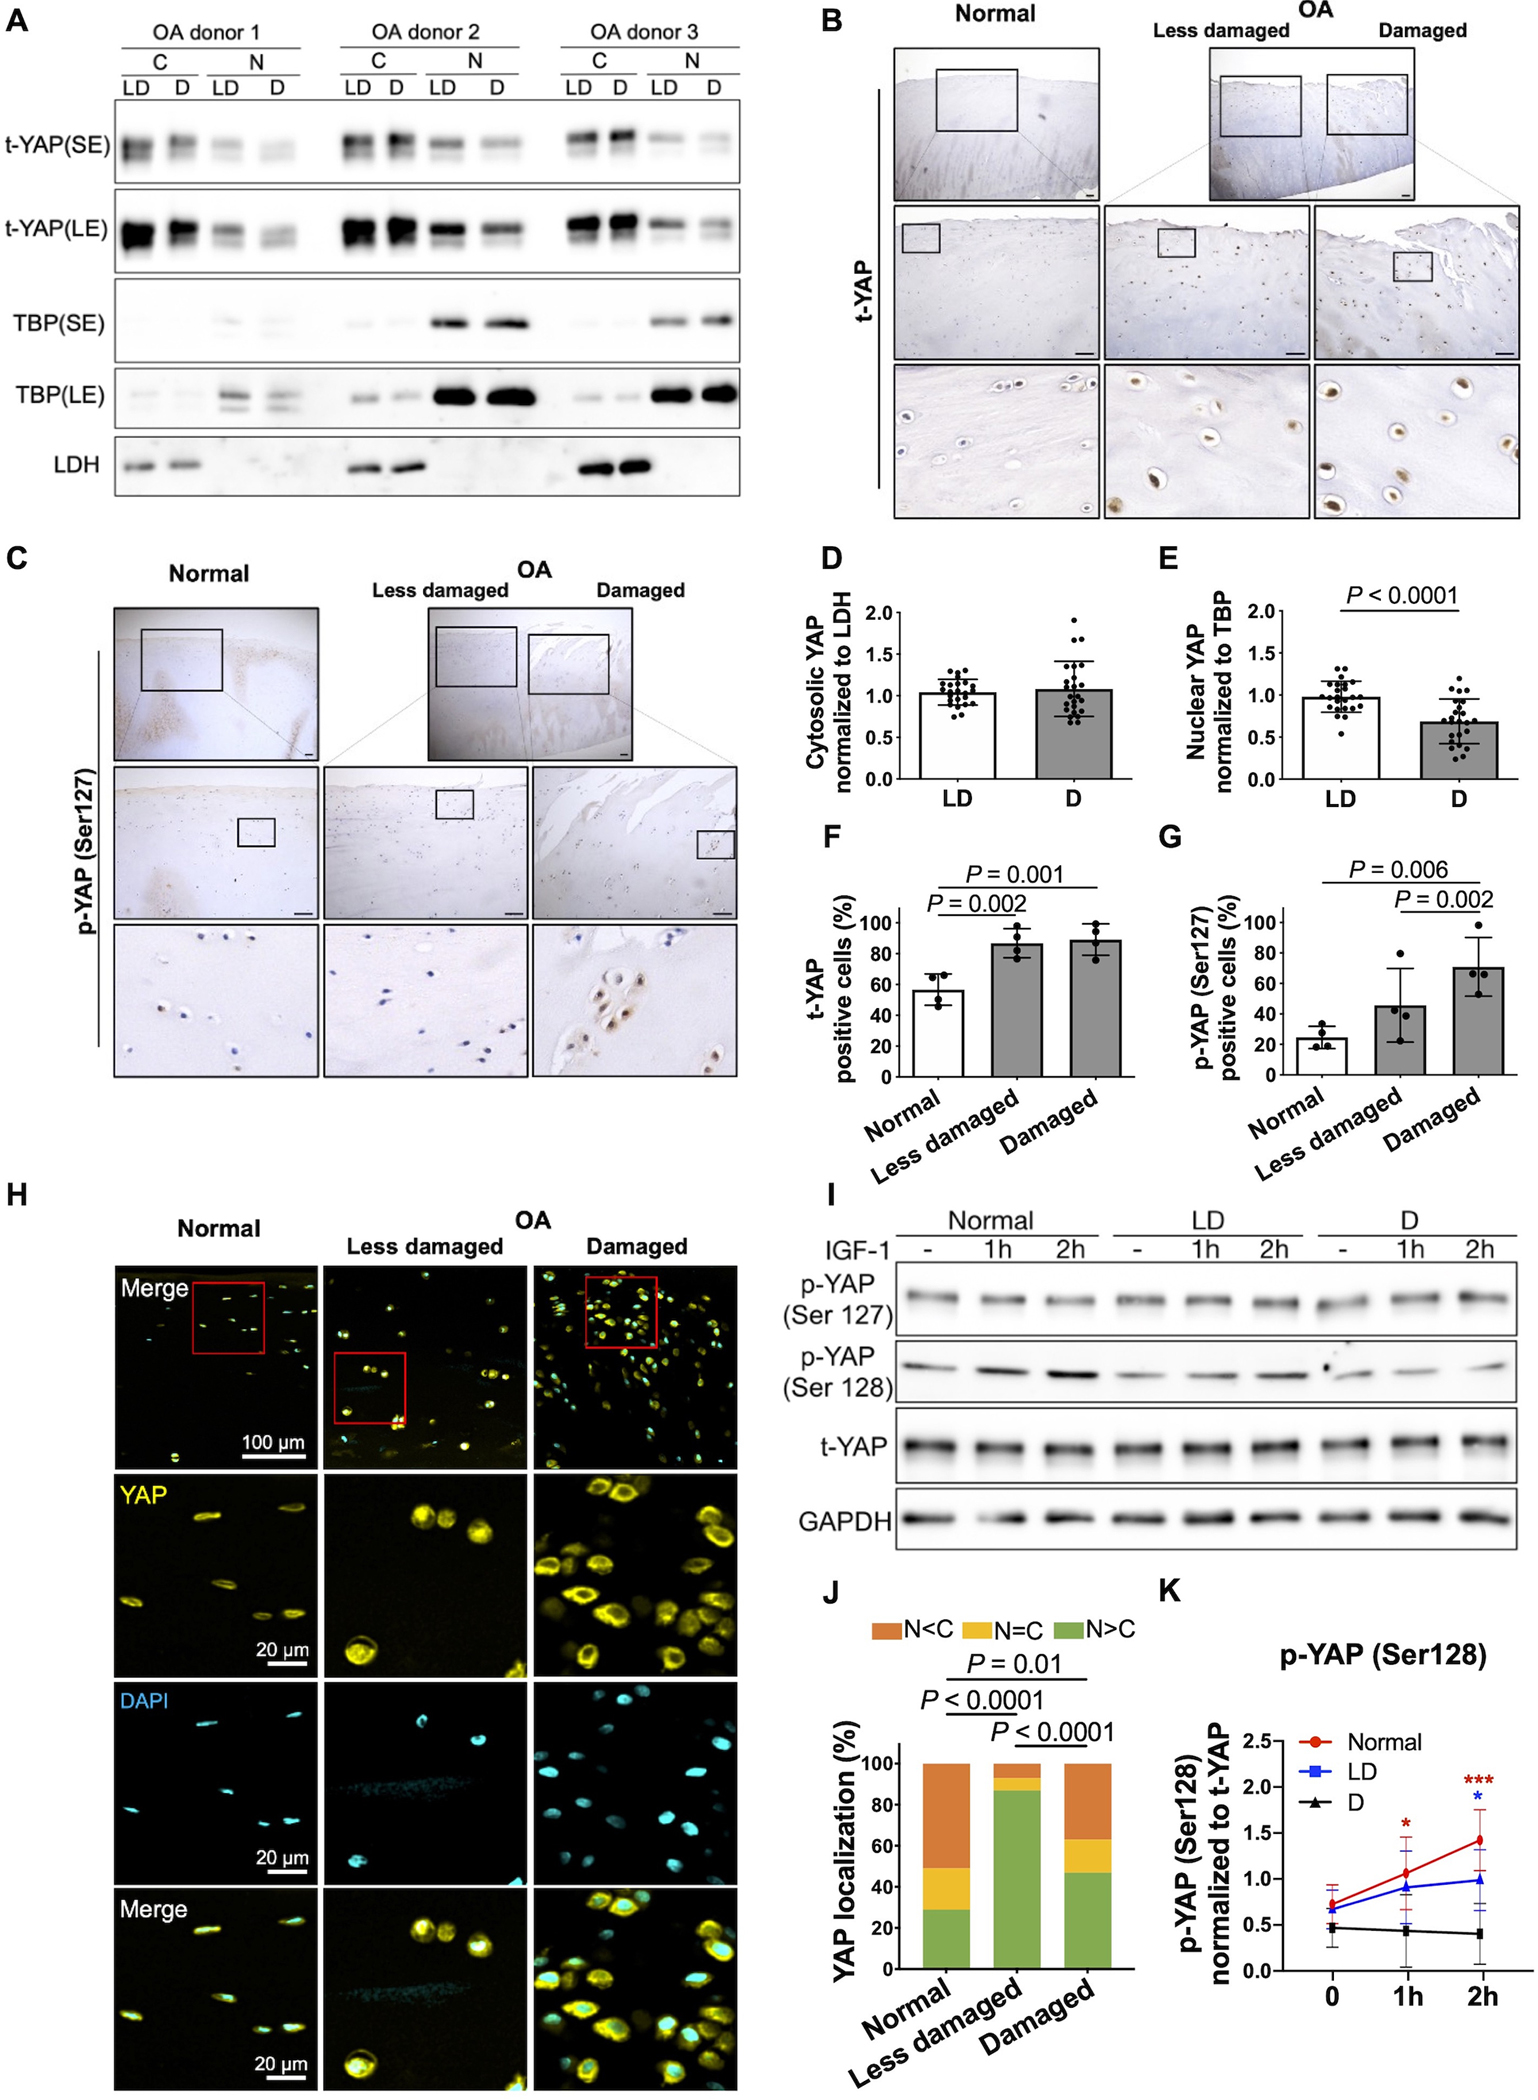
Fig. 7. YAP cytosolic sequestration is associated with YAP Ser127 phosphorylation in human cartilage.

(A) Representative immunoblots of nuclear and cytosolic t-YAP in cultured chondrocytes from less damaged (LD) and damaged (D) areas of the same knee OA donor (t, total; SE, short exposure; LE, long exposure). (B, C) IHC staining for t-YAP and p-YAP (Ser127) in normal femoral cartilage and less damaged and damaged areas from the same OA donor’s femoral cartilage. Representative images from four different donors for each group are shown. Magnified images of regions are marked by black boxes. Scale bar, 100 μm. (D, E) Densitometric analysis of immunoblots of nuclear and cytosolic YAP. The relative band intensity of nuclear and cytosolic YAP was calculated by normalizing to the loading control TBP and LDH, respectively. Data are presented as the mean values ± standard deviation; indicated p-values were determined by paired t-tests used to compare LD to D areas. (n = 24 independent samples from 24 donors). (F, G) The percentages of t-YAP- and p-YAP (Ser127)-positive cells in IHC staining are shown. Data are presented as the mean values ± standard deviation; indicated p-values were determined by paired t-tests used to compare LD to D areas and Welch’s t-tests used to compare normal cartilage to less damaged or more damaged areas in OA donor’s cartilage. (H) Immunofluorescence staining for YAP cellular localization in normal femoral cartilage and less damaged and damaged areas from the same OA donor’s femoral cartilage. Representative images from four normal and four OA donors are shown. Scale bars, 100 μm for low and 20 μm for high magnification (red box). (J) The statistical analysis for YAP cellular distribution (% percentage) (n = 4 for both normal and OA donors). Data are presented as proportion of distribution in the nucleus (N) and cytosol (C) in normal and less damaged and damaged OA cartilage; indicated p-values were determined by Fisher’s exact t-tests used to compare normal cartilage to less damaged or more damaged areas in OA donor’s cartilage. McNemar’s tests were used to compare less damaged to more damaged areas in OA donor’s cartilage. (I) Chondrocytes from normal donors and less damaged (DL) and damaged (D) areas of the same OA donors were treated with IGF-1 (100 ng/ml) for 1 h and 2 h. Representative immunoblots of p-YAP (Ser127), p-YAP (Ser128) and t-YAP are shown (p, phospho-; t, total). (K) Densitometric analysis of p-YAP (Ser128). Data are presented as the mean values with 95% confidence intervals (CIs) (n = 4 independent donors). P-values and confidence intervals were determined by linear mixed effect model. Linear mixed effects model was fit with unstructured covariance structure to account for repeated measures over time. Fixed-effect terms included indicators for group (normal, less damaged and damaged), time in hours and their interaction. To account for more and less damaged regions being collected from a same donor, donor random effect was included in the model.
