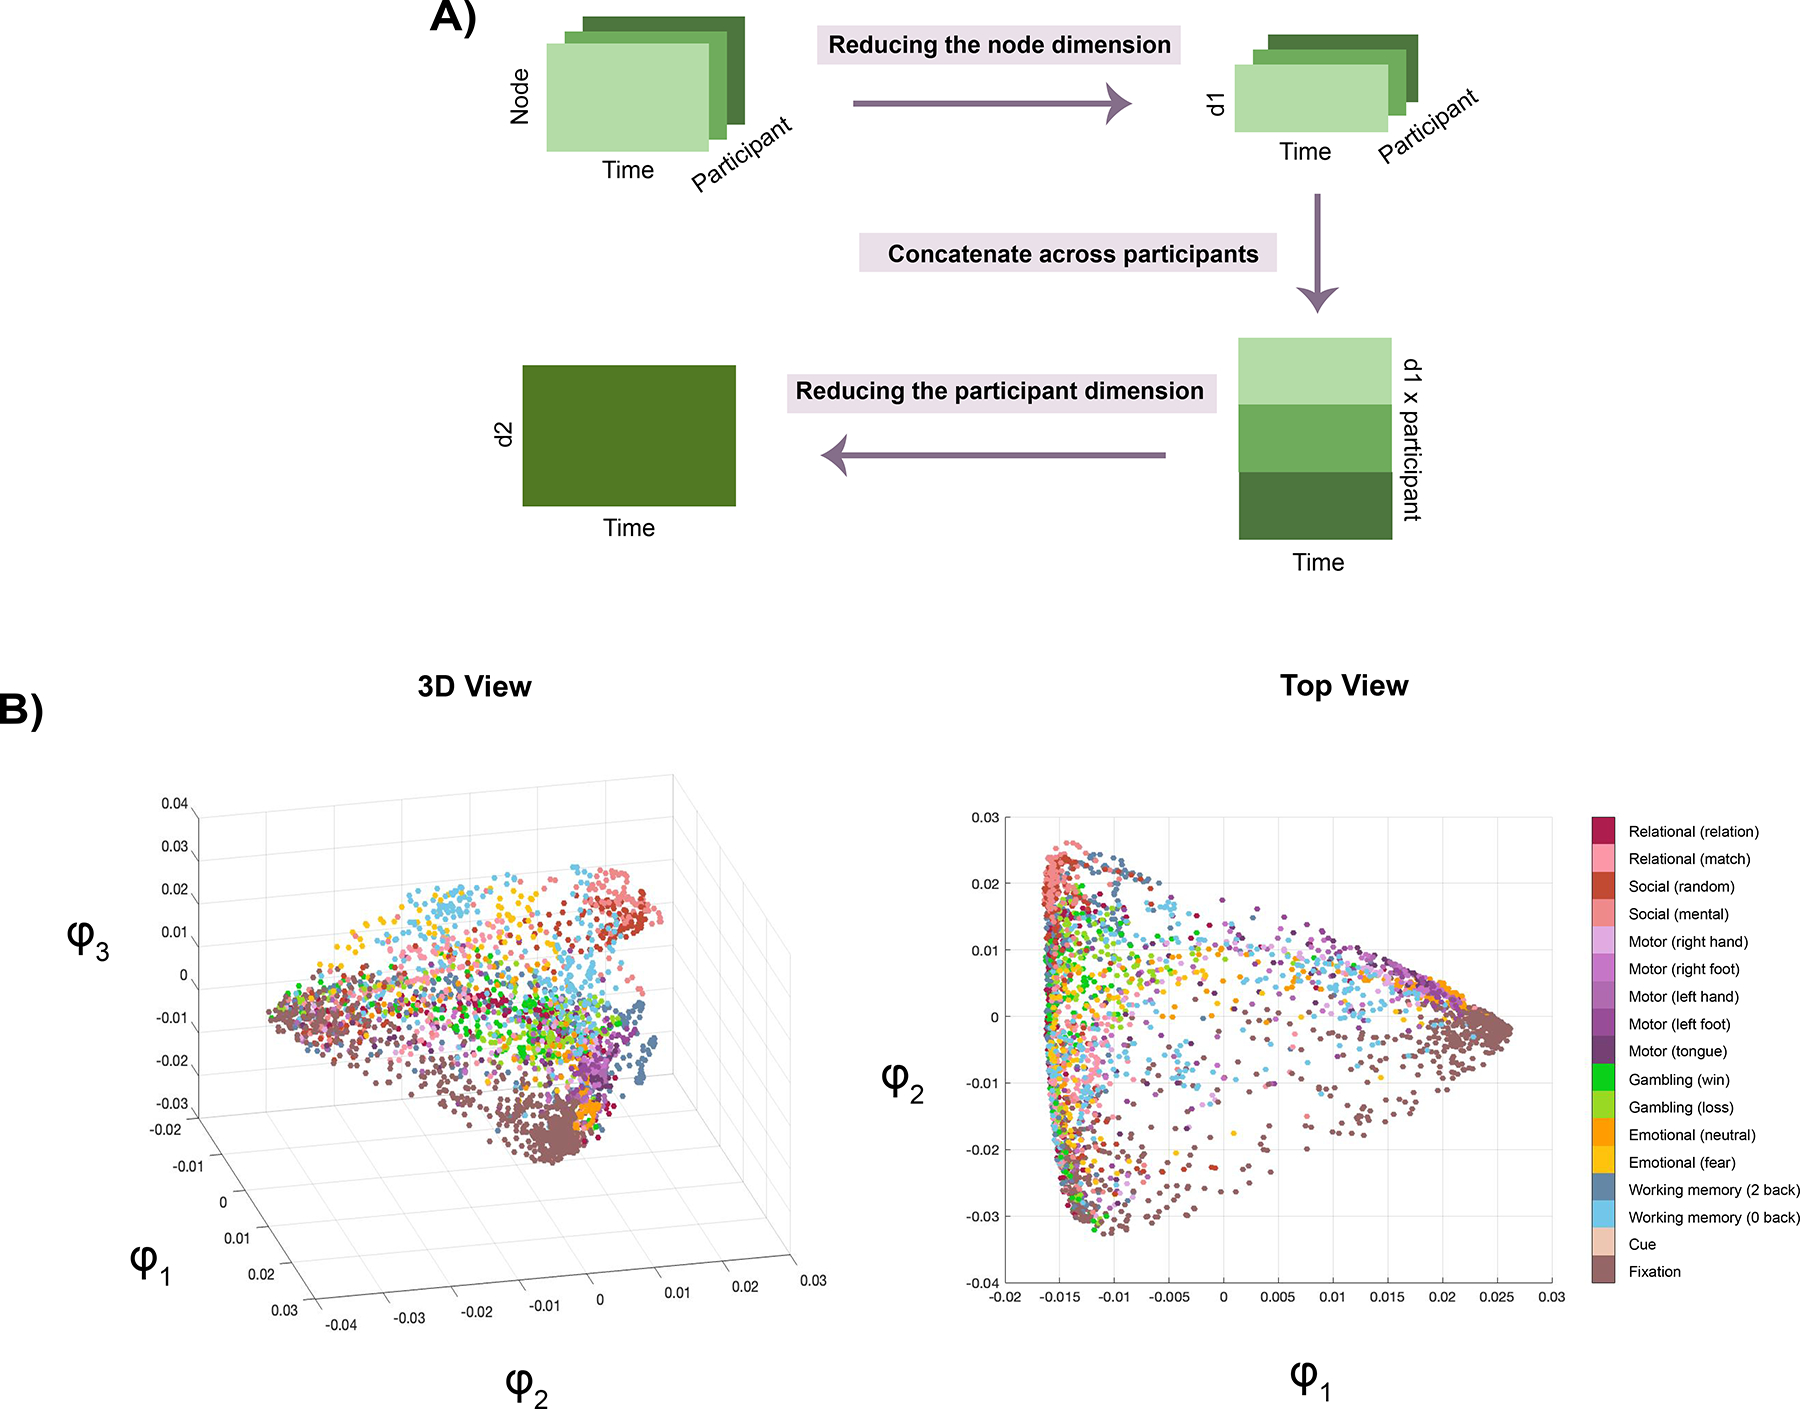
Figure 1: 2sDM pipeline.

A) Flowchart showing how 2sDM was applied to the HCP dataset to first reduce the brain node’s (d1) and participant’s (d2) dimensions before projecting it to a low-dimensional space. B) Several views of the manifold. Each dot here represents a time point, color-coded by the task condition it is associated with. Further details about 2sDM can be found in Gao et al., 2021 (23).
