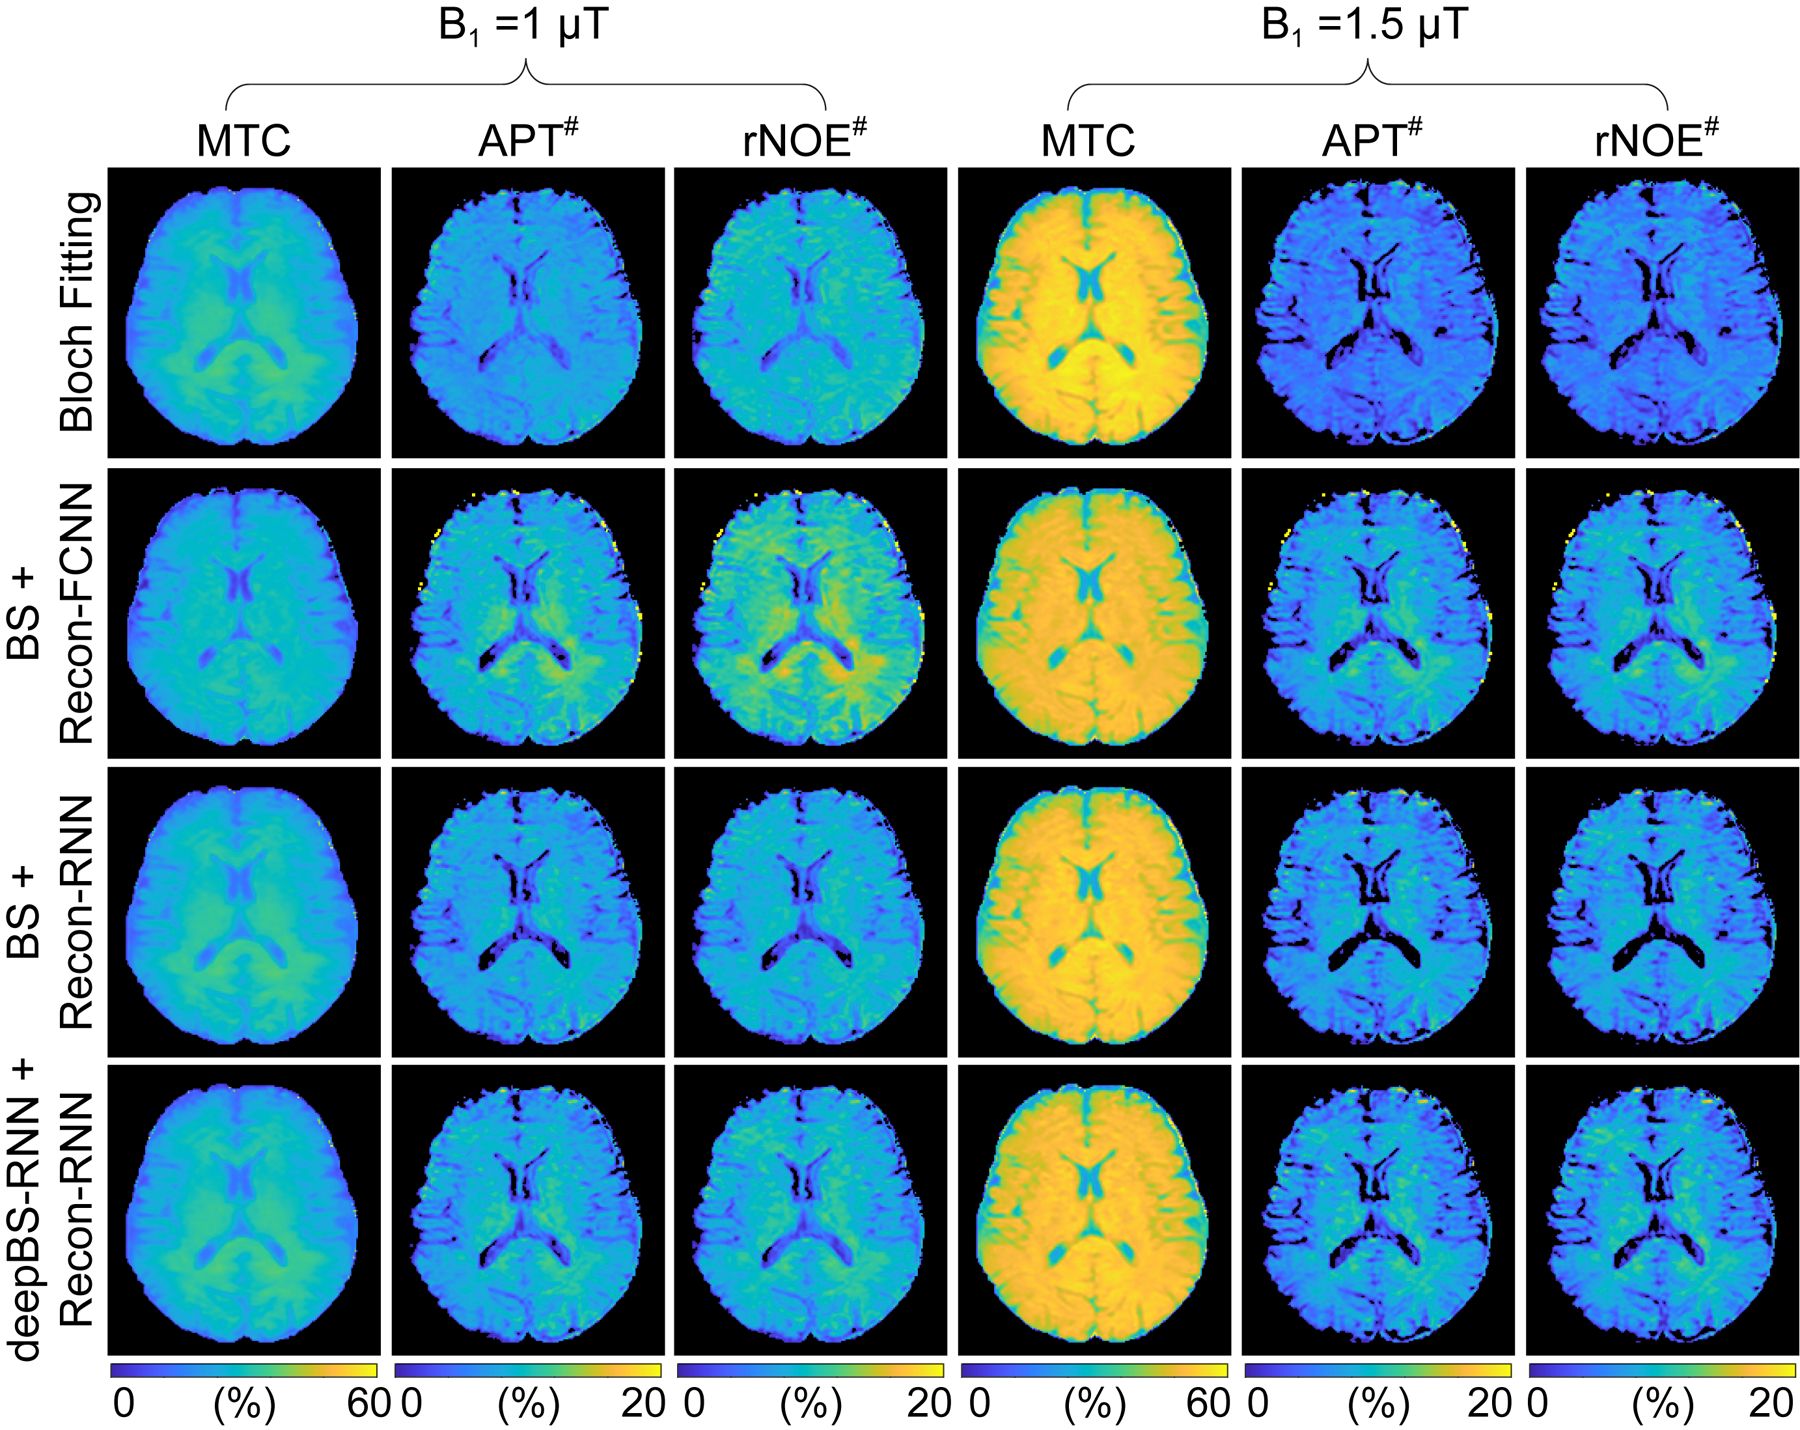
Figure 5.

MTC, APT#, and rNOE# images from the brain of a healthy volunteer. The MTC images were synthesized with RF saturation strengths of 1 μT and 1.5 μT, an RF saturation time of 2 s, a relaxation delay time of 4 s, and a frequency offset of ±3.5 ppm. In this case, the semisolid MTC line-shape was assumed to be symmetric around water. The APT# and rNOE# images were calculated by subtracting acquired saturated images at +3.5 ppm and -3.5 ppm from the synthesized Zref(±3.5 ppm) images (= 100% - MTC(±3.5 ppm)), respectively.
