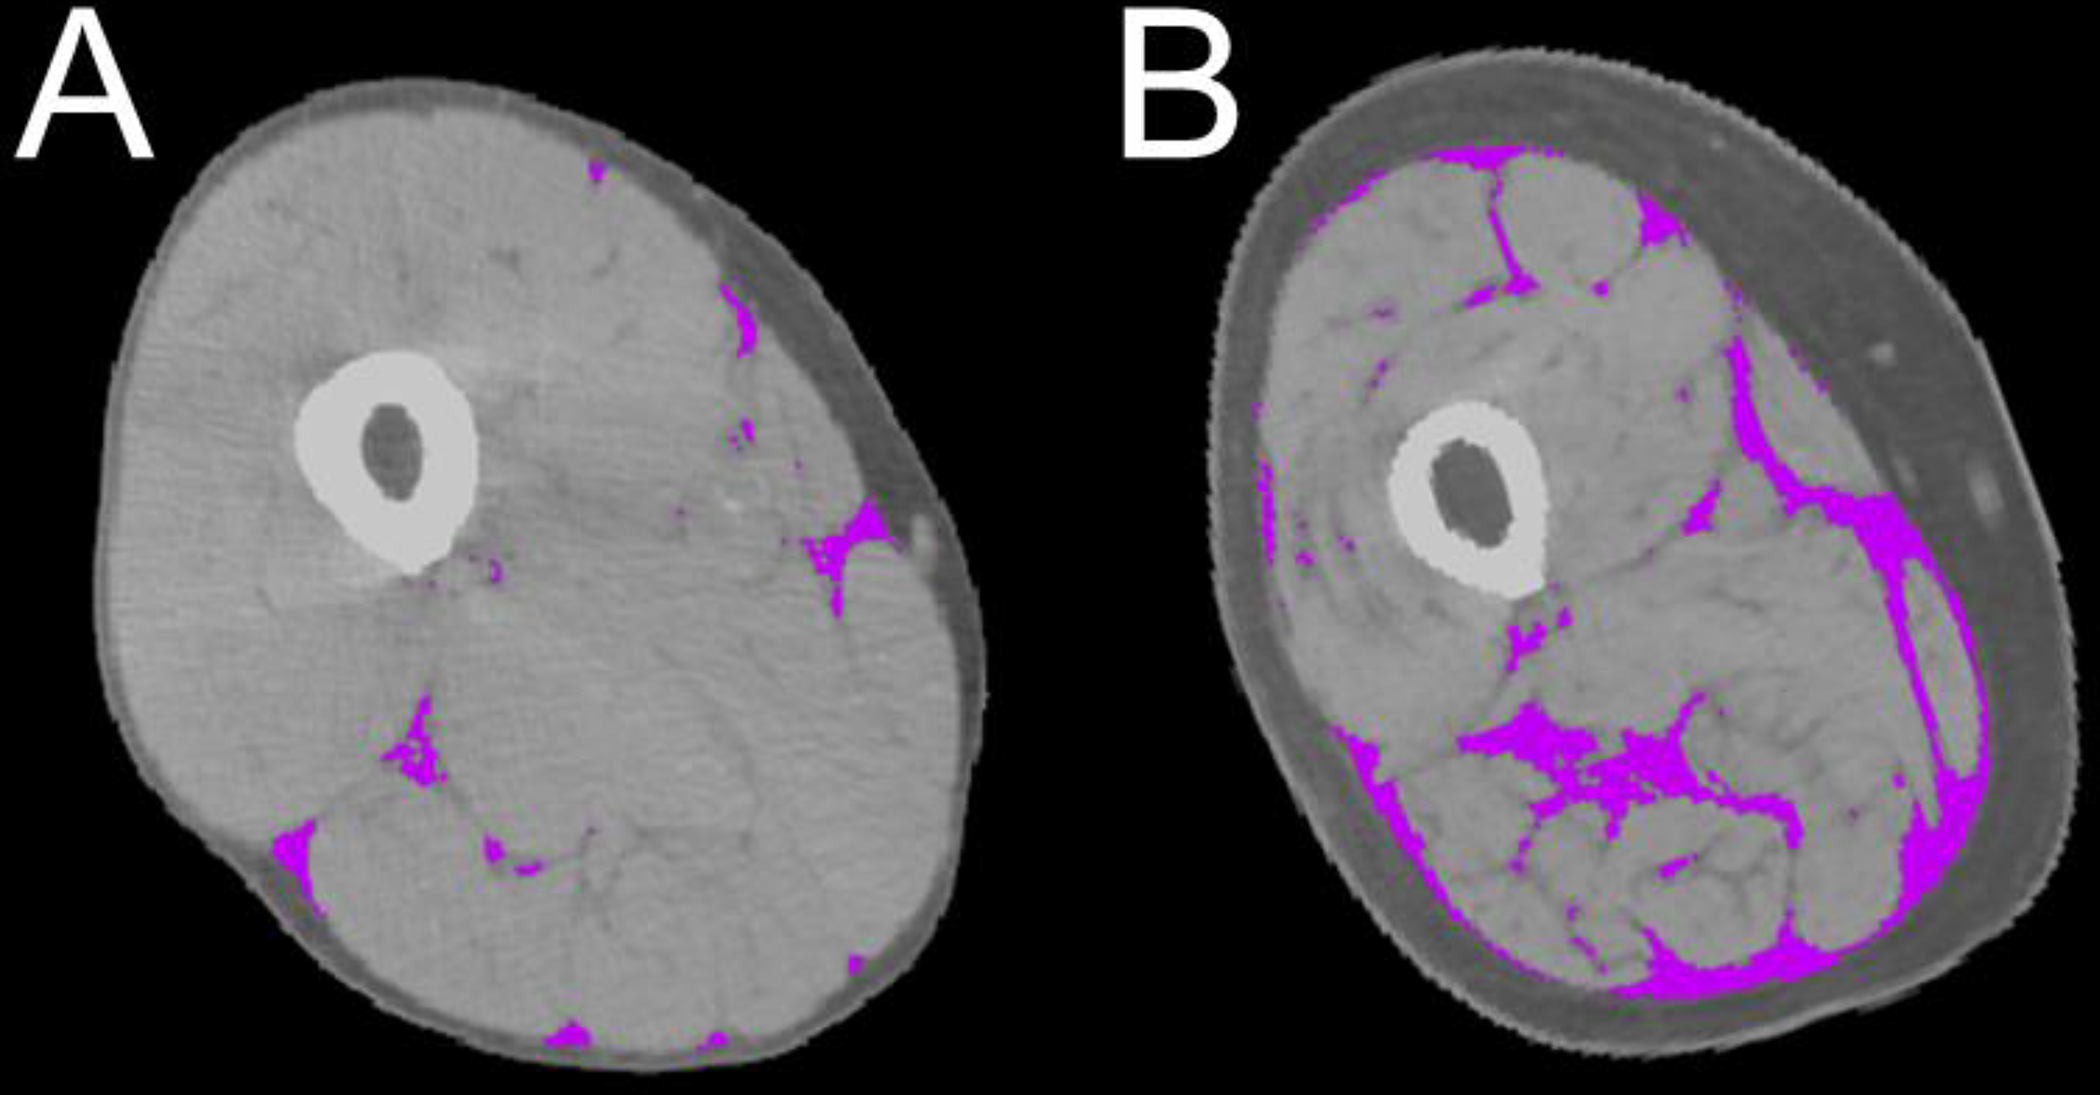
Figure 1. CT scans of the mid thigh of two study participants.

Computer Tomography (CT) scans of the mid thigh of 2 study participants showing intermuscular fat (purple), and subcutaneous fat (darker grey) and muscle parenchyma (lighter gray). Note that, albeit similar in cross-sectional thigh muscle area, adiposity is lower in panel A and higher in panel B.
