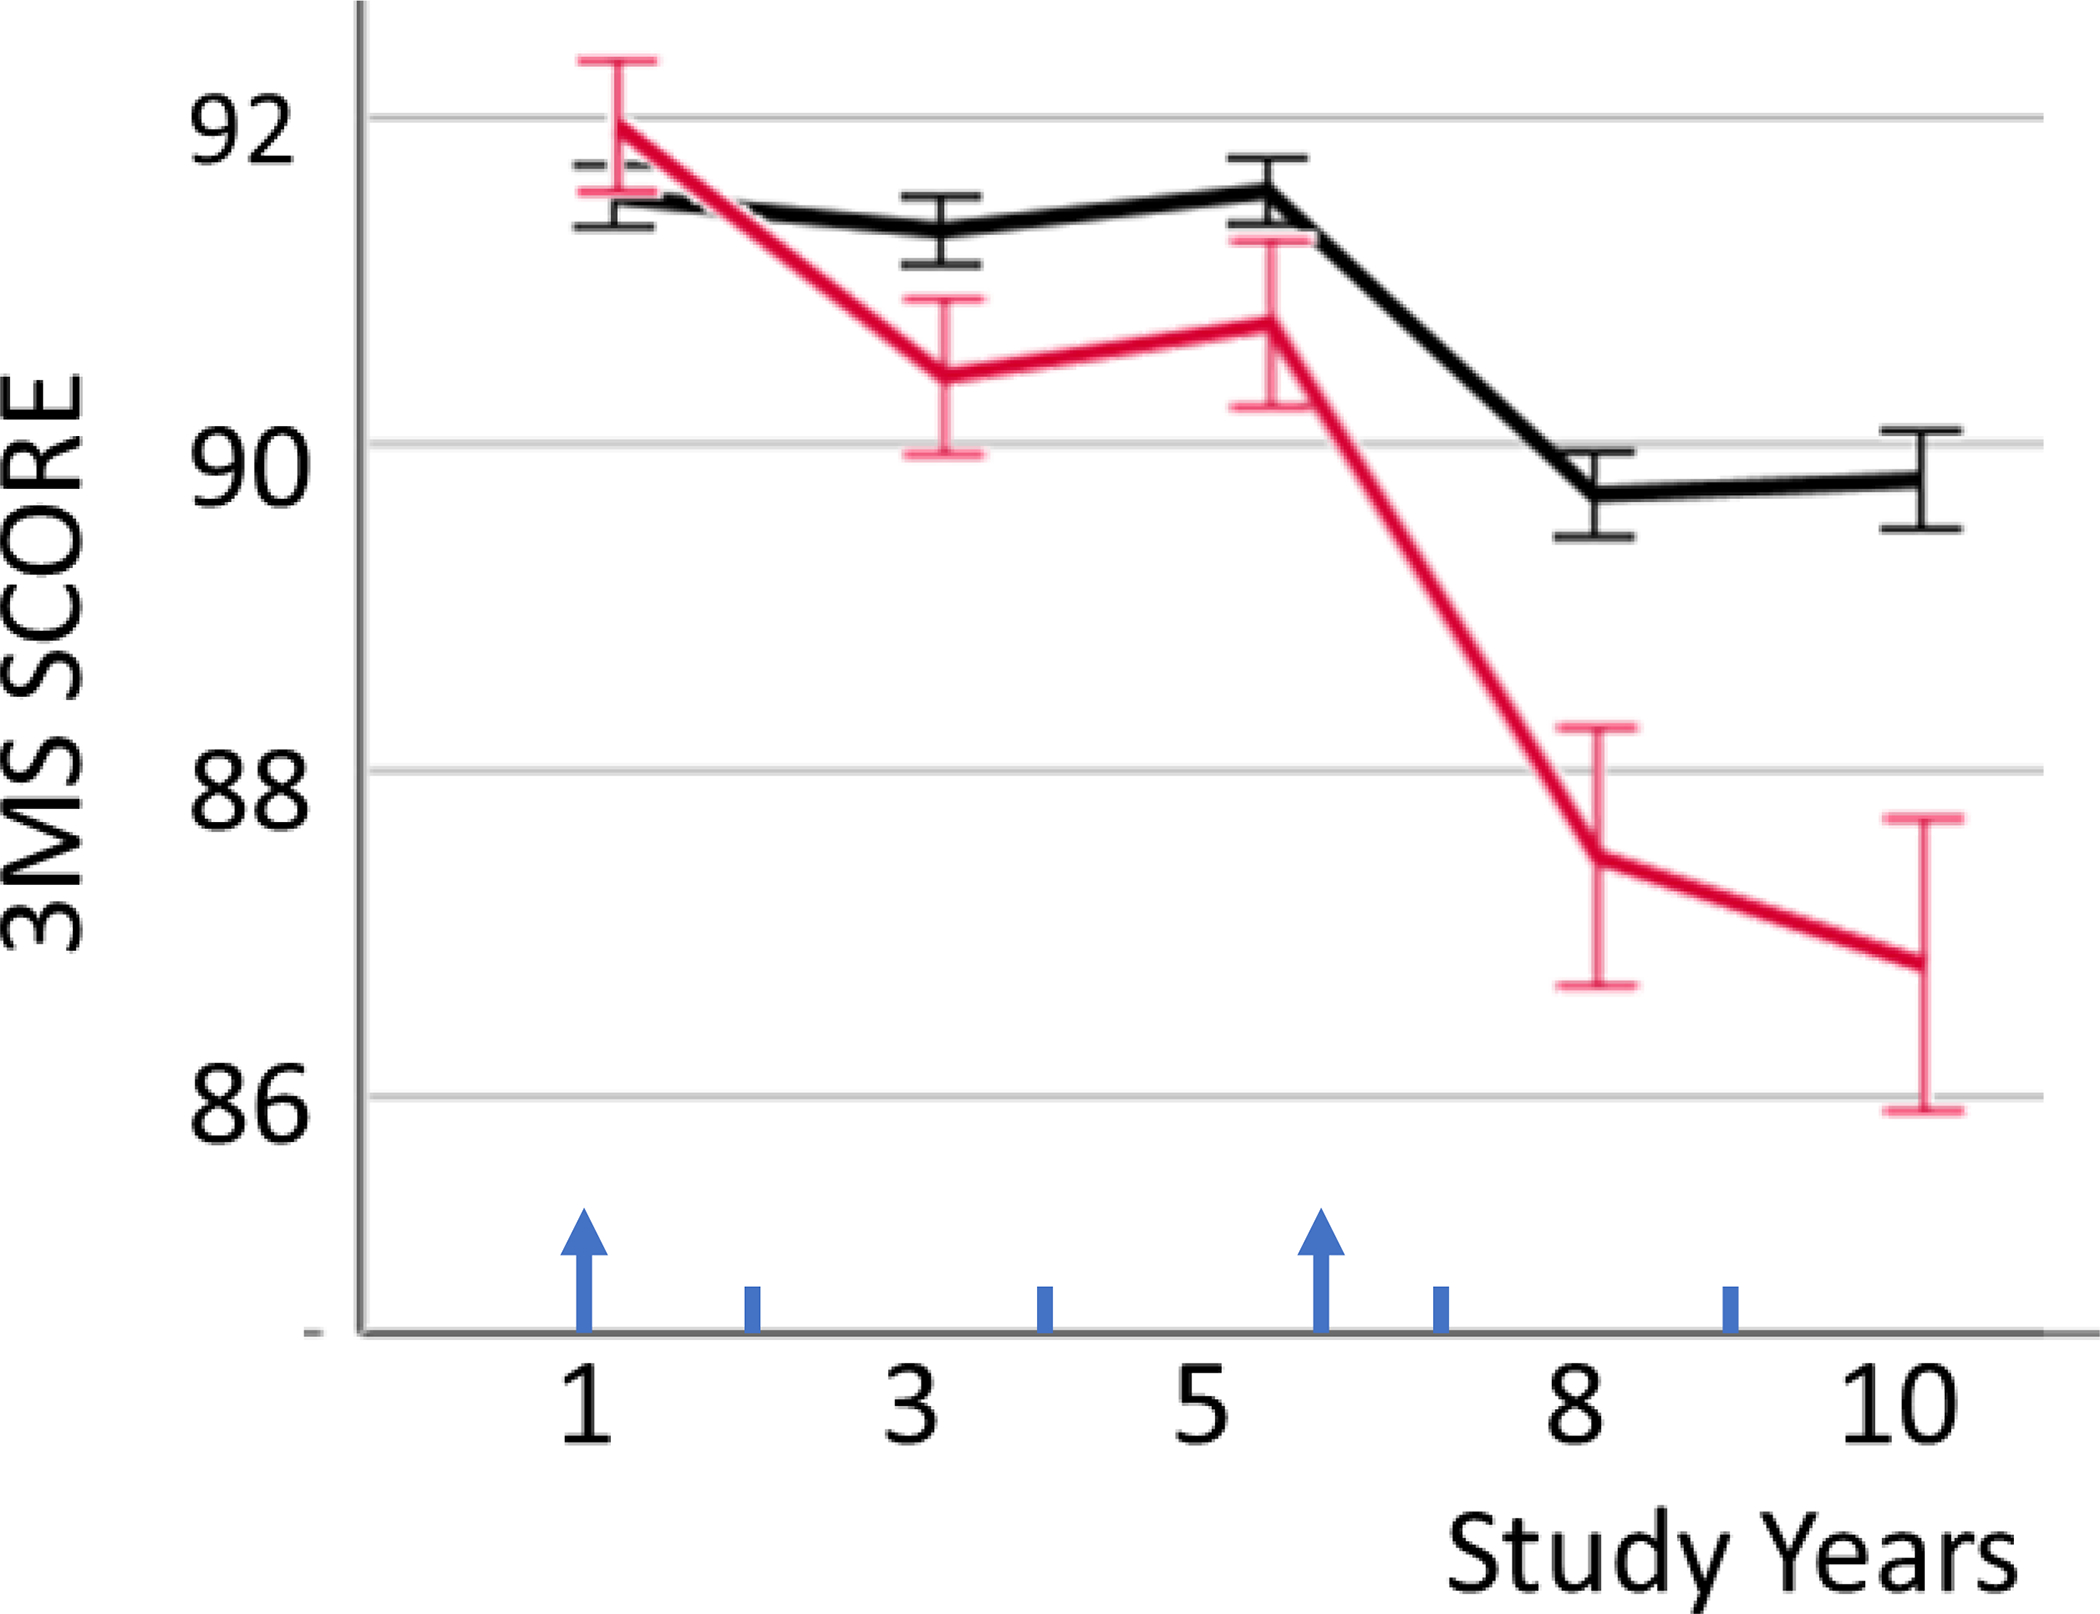
Figure 2: Minimental score (3MS) by increase in thigh IMAT.

Means (standard errors) of Minimental score (3MS) in study year 1 to 10, plotted separately for those with (red) and those without (black) increase in thigh intermuscular adipose tissue (IMAT) from study year 1 to 6 (red: IMAT change > 0; black: IMAT change ≤0). Arrows indicate the two timepoints of IMAT measurements.
