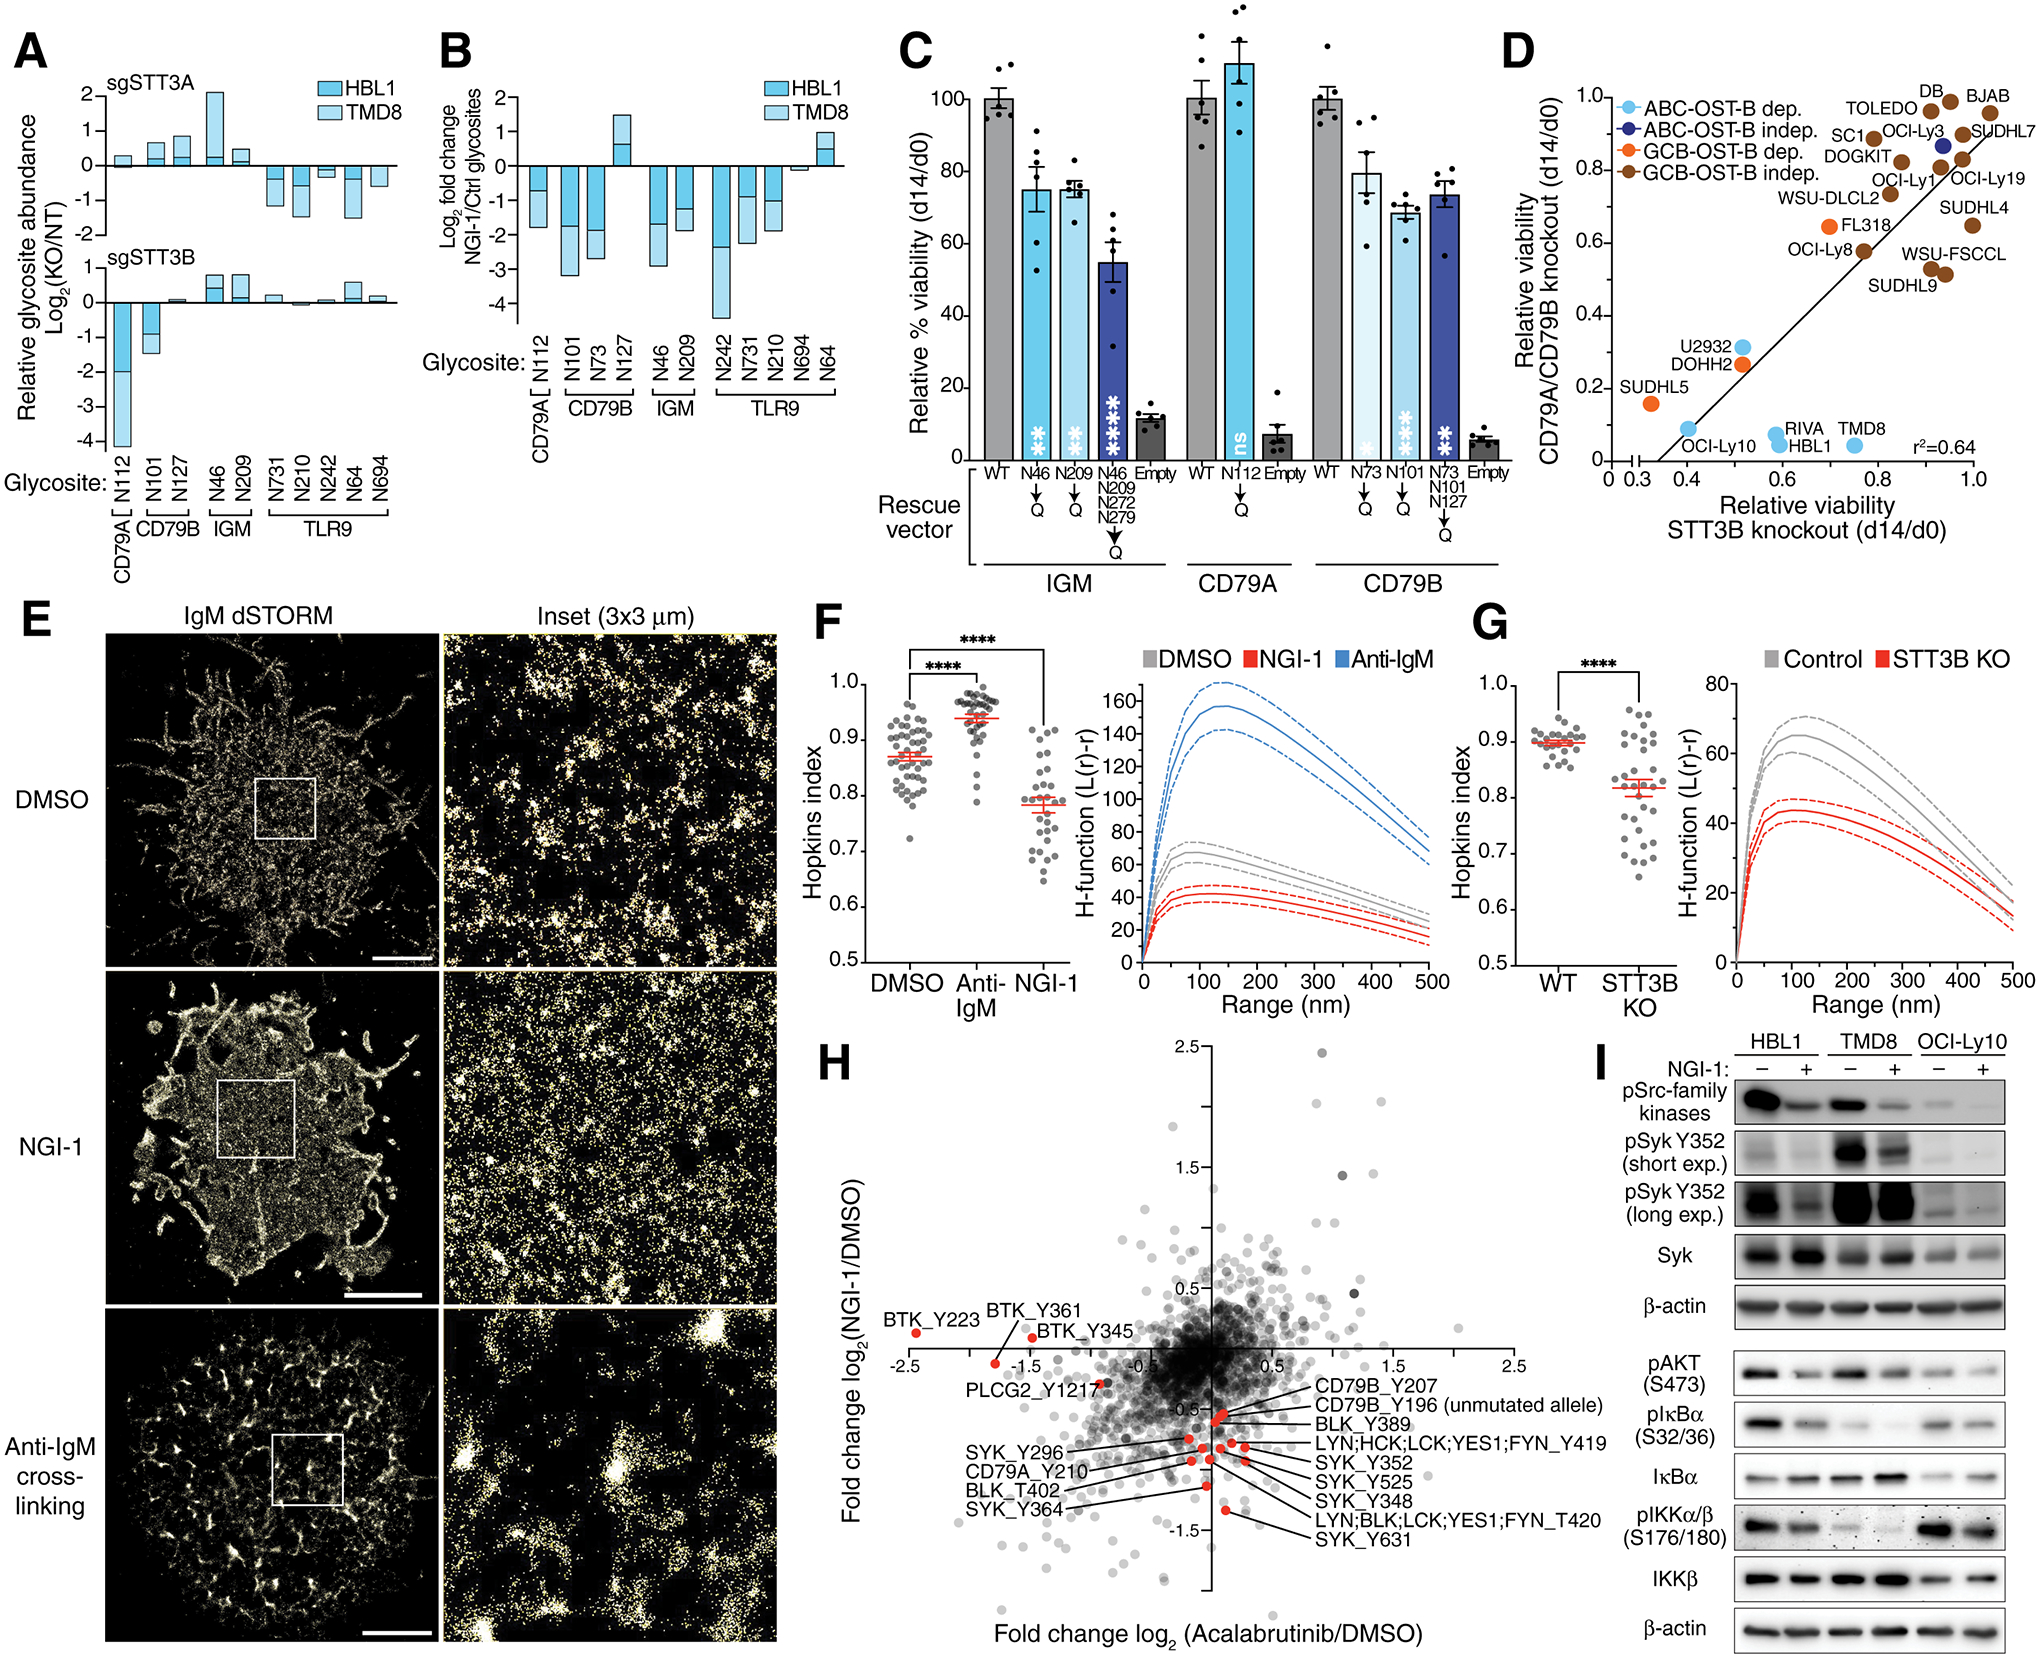
Figure 2. OST-mediated BCR glycosylation regulates its plasma membrane clustering and signaling.

A. Relative glycosite log2 fold changes of the B cell receptor components (CD79A, CD79B and IGM) and TLR9 in HBL1 and TMD8 cells after knockout of STT3A (upper panel) or STT3B (lower panel) assessed by quantitative mass spectrometry. B. Relative glycosite log2 fold changes of the B cell receptor components (CD79A, CD79B and IGM) and TLR9 in HBL1 and TMD8 cells after treatment with NGI-1 assessed by quantitative mass spectrometry. C. Relative rescue capacity (d14 viability/d0 viability) of IgM, CD79A or CD79B wildtype or the indicated mutant Isoforms following knockout of endogenous IgM, CD79A or CD79B. Mean of six replicates (± SEM) is displayed. *P ≤ 0.05, **P ≤ 0.01, ****P ≤ 0.0001 (one-way ANOVA) compared to WT. D. Scatter plot of toxicity of sgRNAs targeting STT3B on the x-axis compared to the mean toxicity of sgRNAs targeting CD79A and CD79B (y-axis) in the indicated cell lines. E. Reconstructed dSTORM single molecule localizations in TMD8 cells stained with an anti-IgM antibody. White square area is shown magnified (right). Scale bar is 3μm. Representative image of 3 or more experiments. F. Quantification of the IgM distribution assessed by dSTORM in using the Hopkin’s index (left panel) and the H-function (right panel) in TMD8 cells treated for 15 min with a full-length anti-IgM antibody or for 24h with NGI-1 as indicated. Error bars (Hopkins index) and dotted lines (H-function) denote the SEM. Data are pooled from three independent experiments with at least 9 cells per experiment. ****P ≤ 0.0001 (one-way ANOVA). G. Quantification of the IgM distribution assessed by dSTORM in using the Hopkin’s index (left panel) and the H-function (right panel) in TMD8 cells after knockout of STT3B. Error bars (Hopkins index) and dotted lines (H-function) denote the SEM. Data are pooled from three independent experiments with at least 9 cells per experiment. ****P ≤ 0.0001 (one-way ANOVA). H. Changes in global phosphotyrosine abundance in HBL1 and TMD8 cells treated for 16h with acalabrutinib (x-axis) or NGI-1 (y-axis). I. Immunoblots using the indicated antibodies in HBL1, TMD8 and OCI-Ly10 cells treated with NGI-1 as indicated for 16h.
