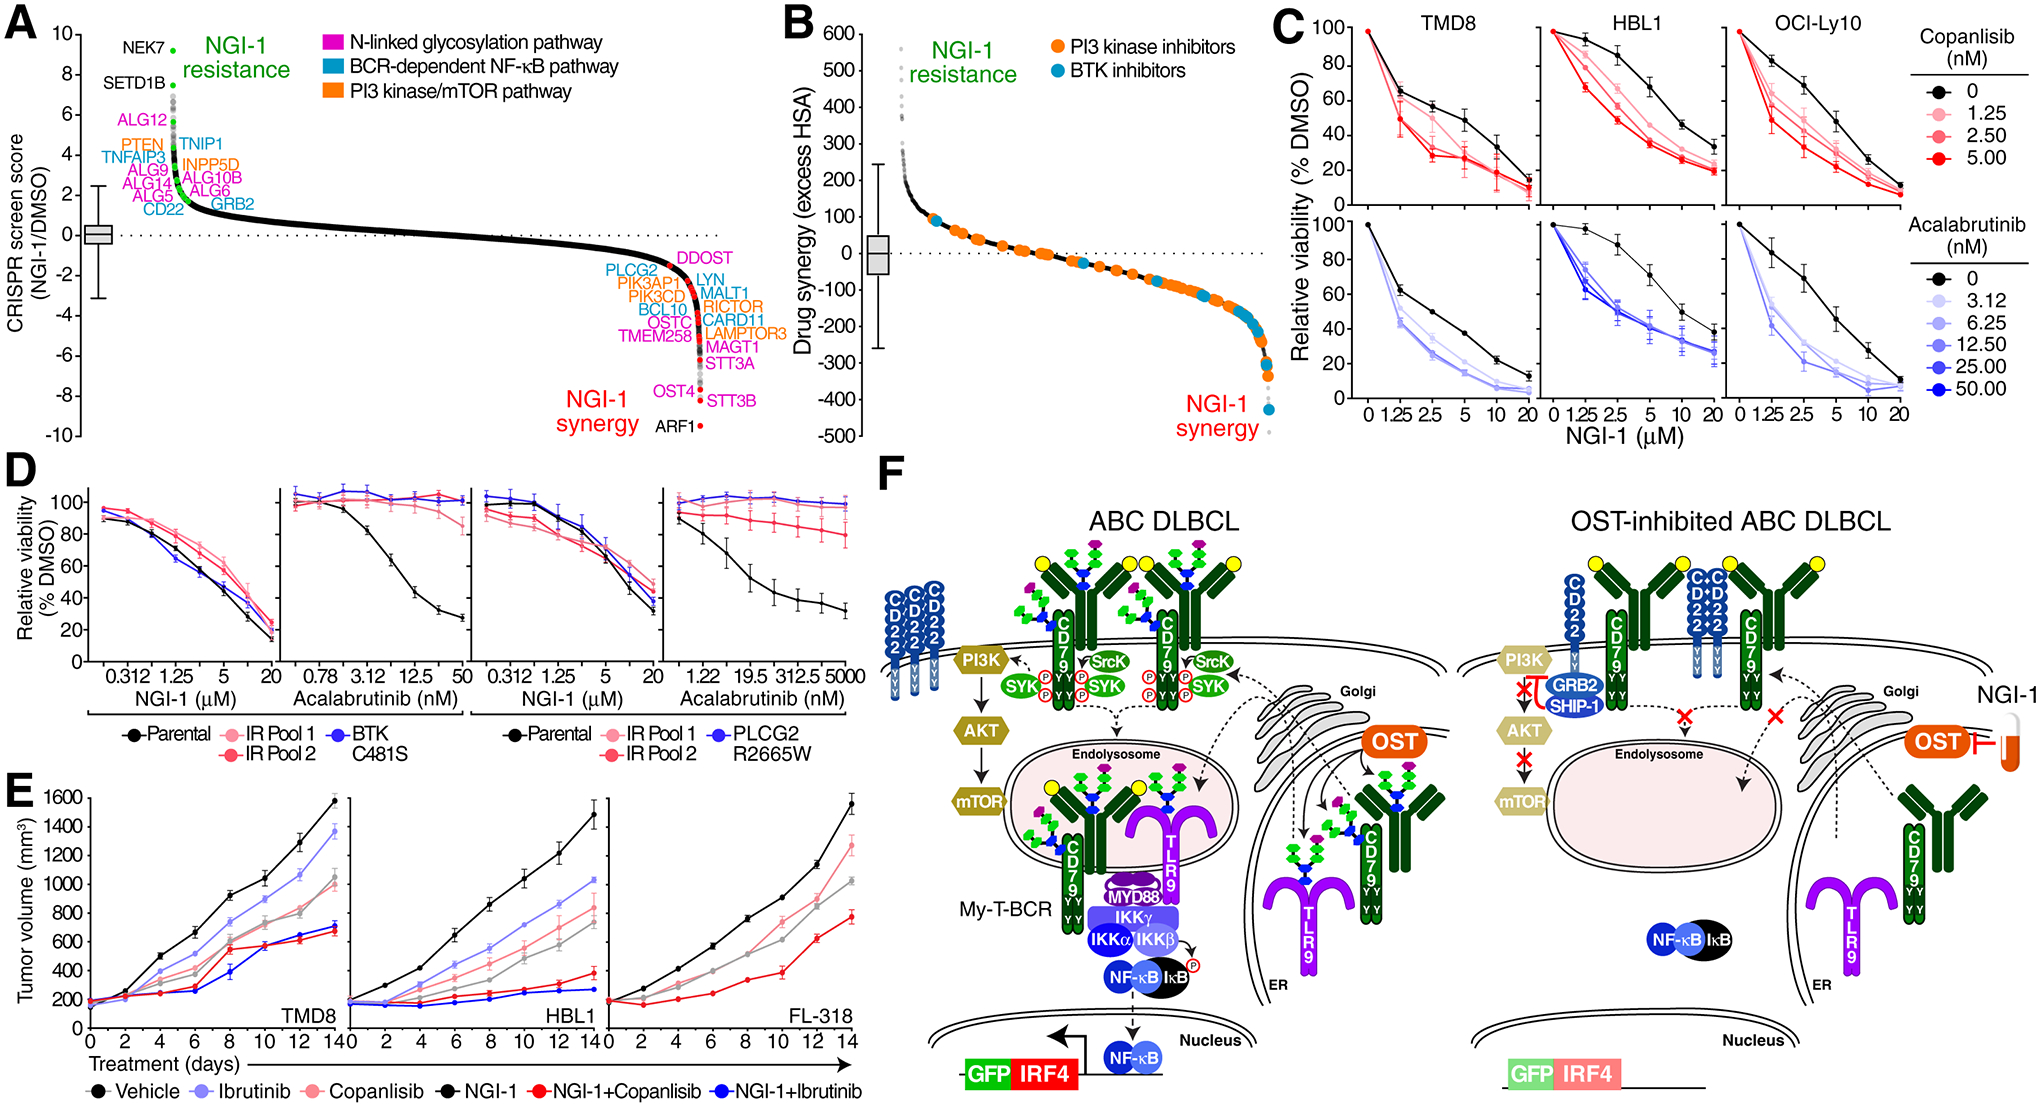
Figure 5. OST inhibition synergizes with targeted therapies.

A. Ranked curve (CRISPR screen score) of an NGI-1 drug modifier CRISPR screen in TMD8 cells treated with NGI-1 vs. DMSO. Hits in the N-linked glycosylation pathway are highlighted in pink, in the BCR/NF-κB pathway in blue and in the PI3K/mTOR pathway in orange. Box and whiskers: 1–99% percentile. B. Ranked curve of drug synergy/antagonism in high throughput combinatorial drug screens in TMD8 ABC cells of NGI-1 in combination with the MIPE v. 5.0 small molecule library. BTK inhibitors (red) and PI3K inhibitors (blue) are highlighted. Boxplot represents 1–99% percentile. C. MTS proliferation assays for TMD8, HBL1 or OCI-Ly10 cells treated with vehicle (black) and indicated doses of copanlisib (red) or acalabrutinib (blue) with the indicated doses of NGI-1 (x-axis). D. MTS proliferation assays for BTK inhibitor resistant TMD8 or HBL1 cells treated with indicated doses of NGI-1 (x-axis). IR, ibrutinib resistant. E. Growth of TMD8, HBL1 or FL318 xenografts in NSG mice treated with the indicated drugs. F. Model of OST regulation of oncogenic signaling in lymphoma.
