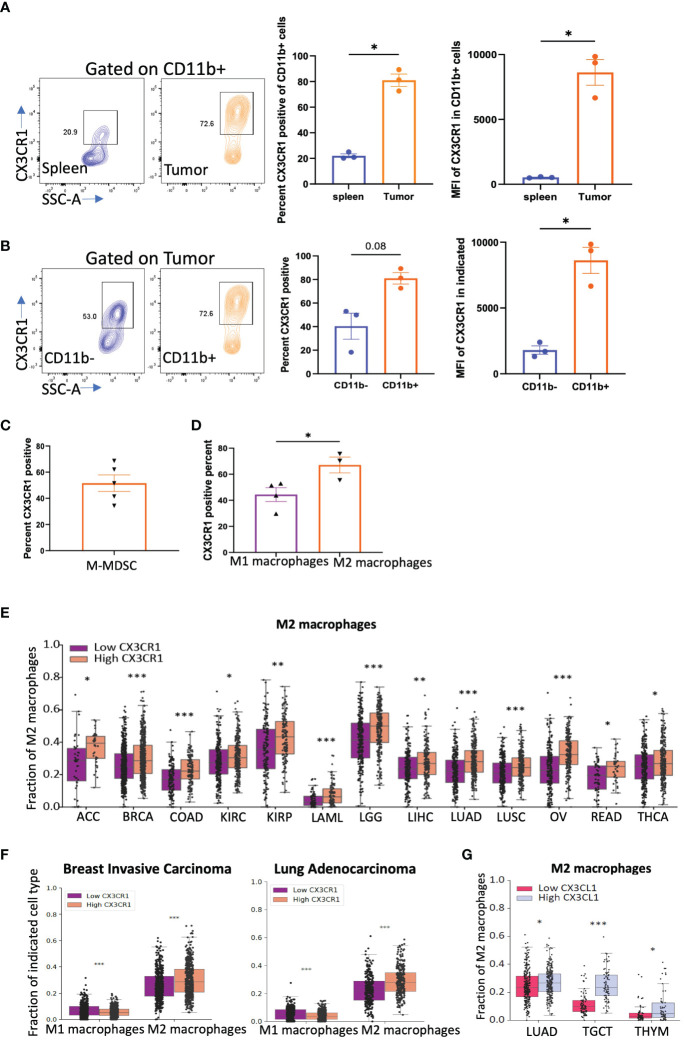
Figure 3.
CX3CR1 expression on myeloid cells in the CT26 tumor. (A) FACS analysis of CX3CR1 expression on CD11b+ myeloid cells in spleen or CT26 tumors from mice (n=3) with tumor diameter of 0.5 cm. (B) CX3CR1 expression on CD11b+ and CD11b- cells in CT26 tumors from mice (n=3) with tumor diameter of 0.5 cm. (C) CX3CR1 expression in M-MDSC (CD11b+Ly6C+Ly6G-) cells in CT26 tumors from mice (n=5) with tumor diameter of 1 cm. (D) CX3CR1 expression on M1 macrophages (CD11b+F4/80+Gr1-MHCII+), and M2 macrophages (CD11b+F4/80+Gr1-CD206+) in CT26 tumors from mice (n=5) with tumor diameter of 1 cm. Data representative of two-three independent experiments. (E) Fraction of M2 macrophages in human cancers grouped as CX3CR1-high and -low by the median value of its expression and analyzed using CIBERSORT. (F) Fraction of M1 and M2 macrophages in human cancers grouped by high and low by the median value of CX3CR1. (G) Fraction of M2 macrophages in human cancers grouped by high and low by the median value of CX3CL1 expression. (A-D) Data as standard error of the mean, paired t-test. *p<0.05, (E-G) Statistical analysis using R package limma. *q<0.05, **q<0.01, ***q<0.001.

