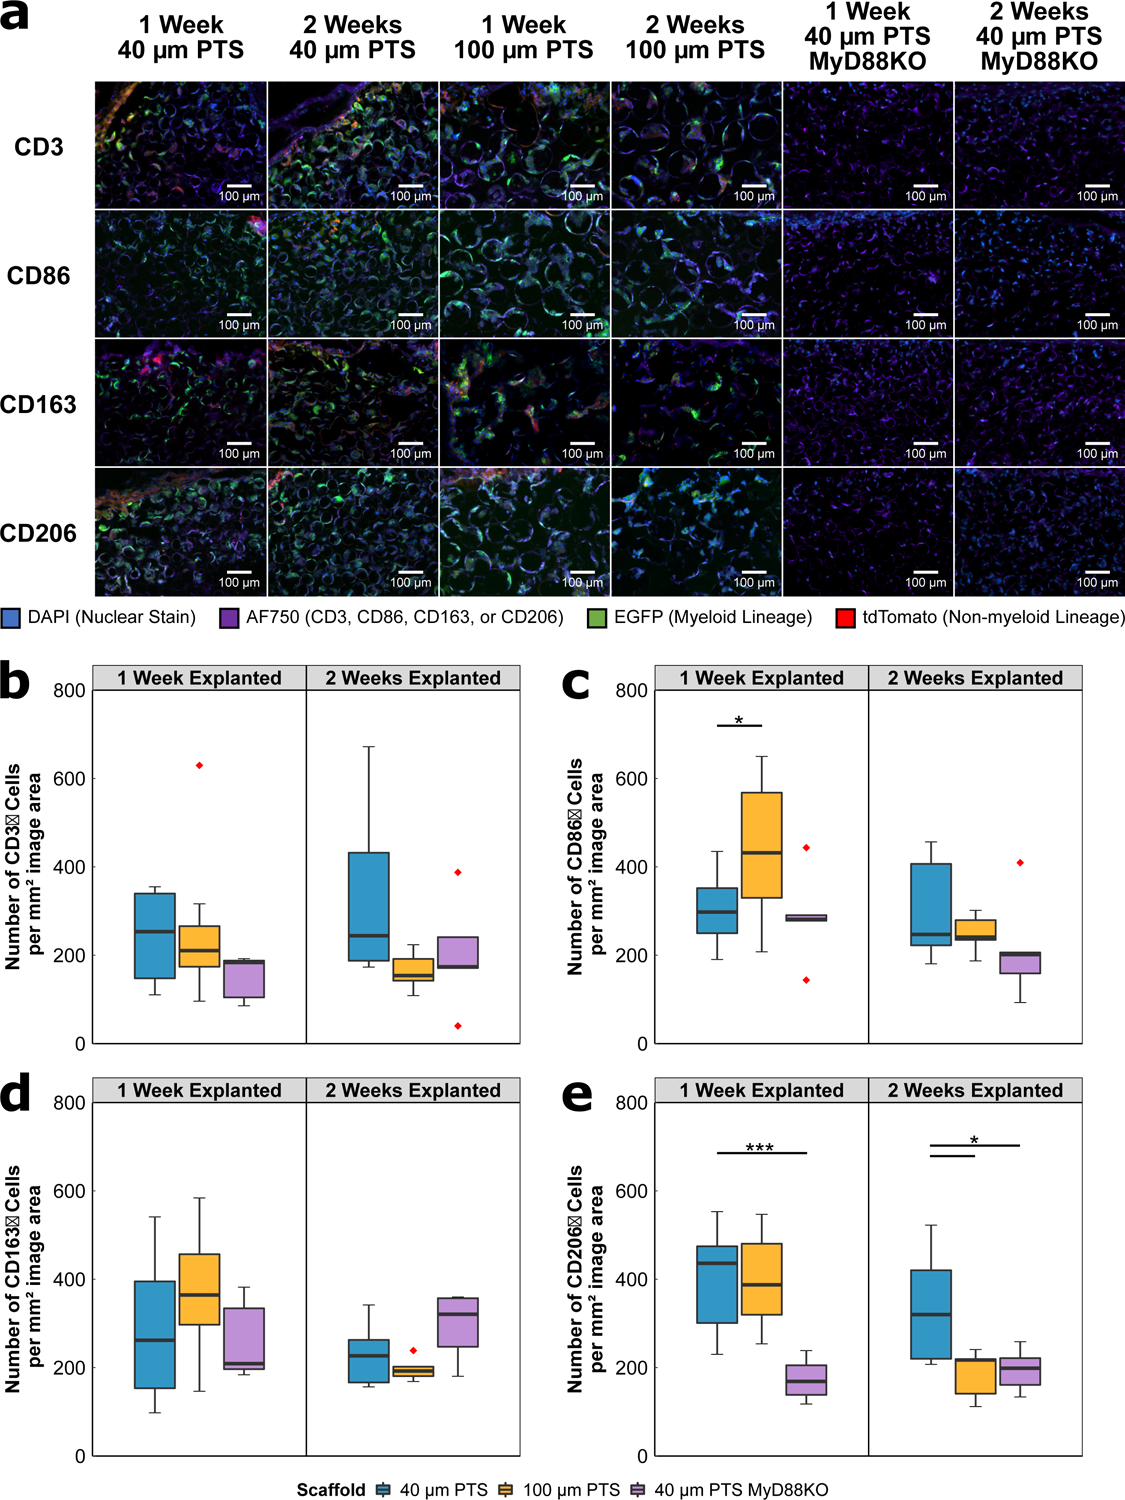
Figure 3:

(A) Immunofluorescent images of scaffold tissue sections from either 40 μm PTS or 100 μm PTS implanted subcutaneously in separate LysM-Cre:mTmG mice, and from 40 μm PTS implanted subcutaneously in MyD88KO mice (40 μm PTS MyD88KO). PTS were explanted at either one week or two weeks post-implantation. Colors are blue = nuclei (DAPI), purple = CD3, CD86, CD163, or CD206 (AF750), green = myeloid lineage (EGFP), and red = non-myeloid lineage (tdTomato). HALO® image analysis was performed on single color positive immunofluorescence using a primary antibody specific to (B) CD3, (C) CD86, (D) CD163, and (E) CD206, and secondary antibody for AF750. * denotes p < 0.05, ** denotes p < 0.01, and *** denotes p < 0.001. 40 μm PTS (n = 10 at one week explanted, n = 6 at two weeks explanted), 100 μm PTS (n = 8 at one week explanted, n = 5 at two weeks explanted), and 40 μm PTS in MyD88KO mice (n = 5 at one week and two weeks explanted). Red diamonds denote values greater than 1.5 × IQR.
