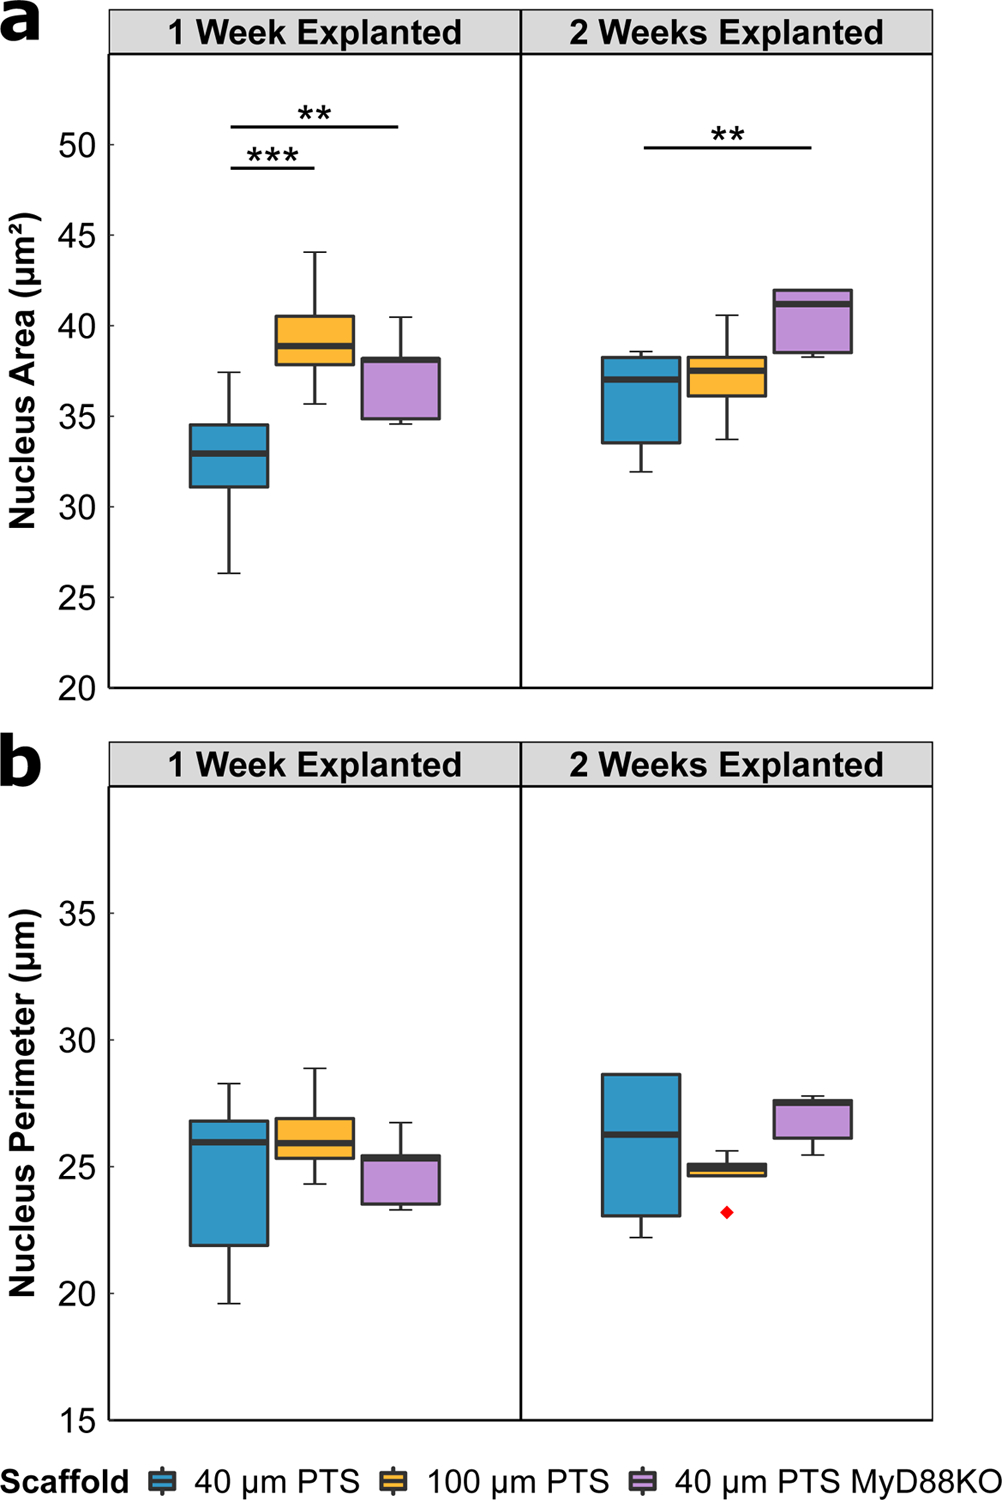
Figure 4:

Nuclear morphology image analysis of scaffold tissue sections from either 40 μm PTS or 100 μm PTS implanted subcutaneously in separate LysM-Cre:mTmG mice, and from 40 μm PTS implanted subcutaneously in MyD88KO mice (40 μm PTS MyD88KO). PTS were explanted at either one week or two weeks post-implantation. Analysis was performed on DAPI-labeled cell nuclei to calculate (A) nucleus area and (B) nucleus perimeter. * denotes p < 0.05, ** denotes p < 0.01, and *** denotes p < 0.001. 40 μm PTS (n = 10 at one week explanted, n = 6 at two weeks explanted), 100 μm PTS (n = 8 at one week explanted, n = 5 at two weeks explanted), and 40 μm PTS in MyD88KO mice (n = 5 at one week and two weeks explanted). Red diamonds denote values greater than 1.5 × IQR.
