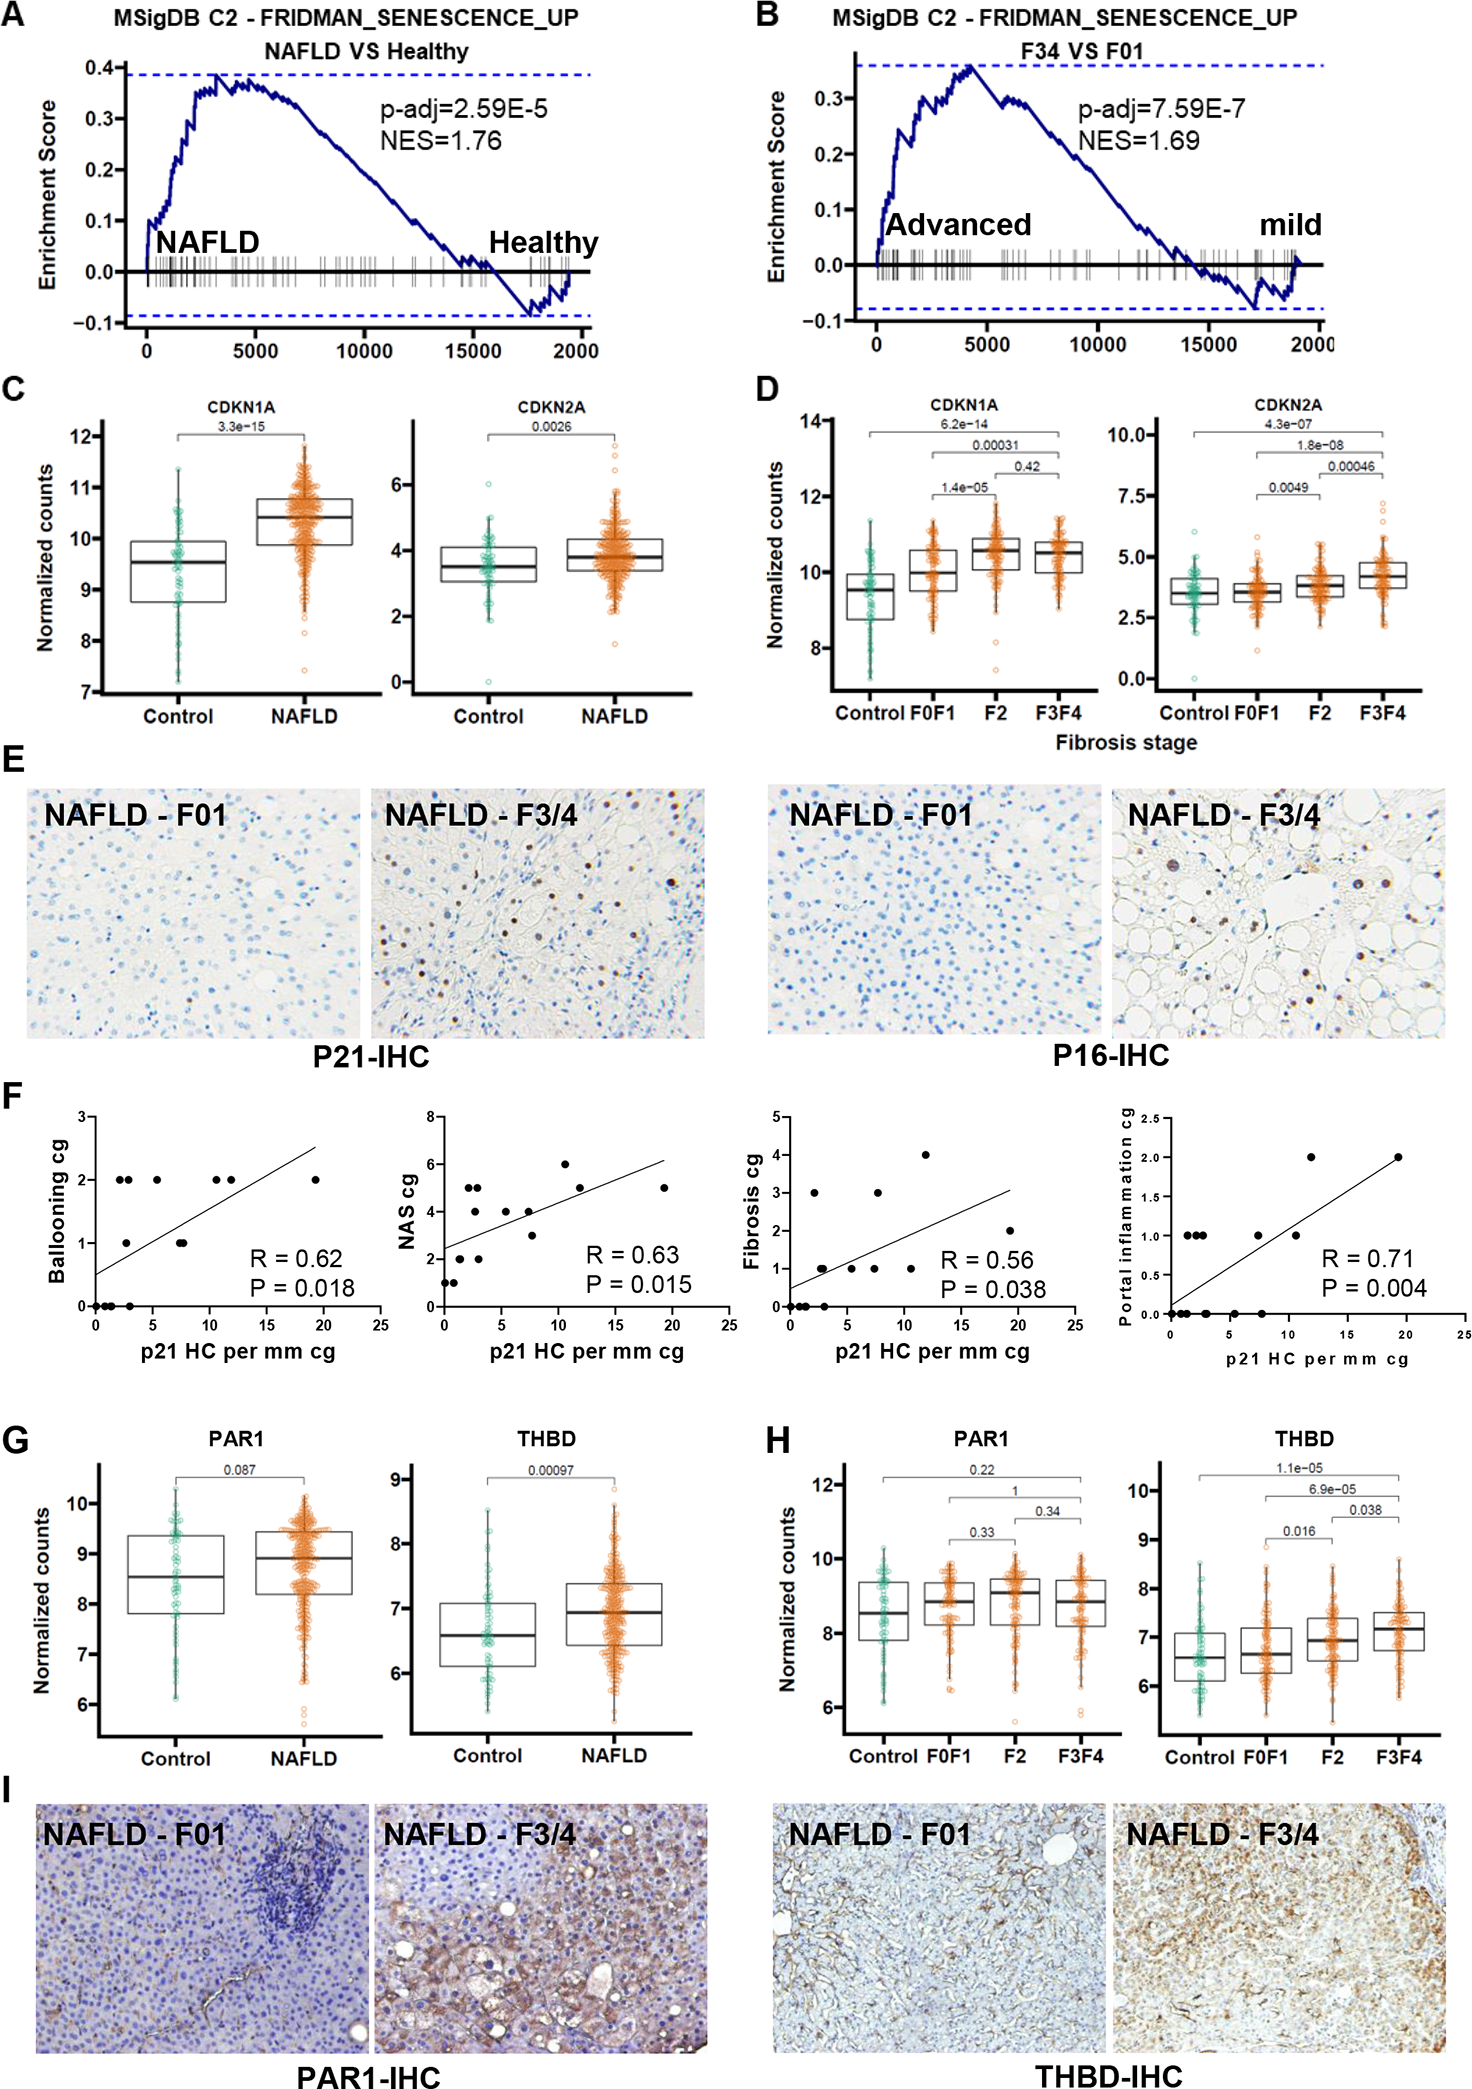
Figure 1. Senescence markers and THBD-PAR1 correlate with severity of NASH in humans.

Genome set enrichment analsysis of GSE213623 RNAseq dataset, which includes 368 liver biopsies from healthy controls or patients with NAFLD and F0/F1, F2, or F3/F4 fibrosis (A and B). CDKN1A (P21) and CDKN2A (P16) mRNA levels based on NAFLD diagnosis (C) and fibrosis stage (D). Representative micrographs (100X magnification) of P21 and P16 immunostaining from NAFLD livers with mild (F0–1) or advanced (F3–4) stage fibrosis (E). Pearson correlation measuring the strength of the linear relationship between +P21 hepatocytes and Ballooning, Fibrosis, NAS Score and Portal Inflammation in liver biopsies from a validation NAFLD cohort (Supplementary Table 1) (F). PAR1 and THBD mRNA levels based on NAFLD diagnosis (G) and fibrosis stage (H). Representative micrographs (100X magnification) of PAR1 and THBD immunostaining in human NAFLD livers with mild (F0–1) or Advanced (F3–4) NAFLD fibrosis (I). RNAseq cohort n=368 patients; validation cohort n = 15 patients.
