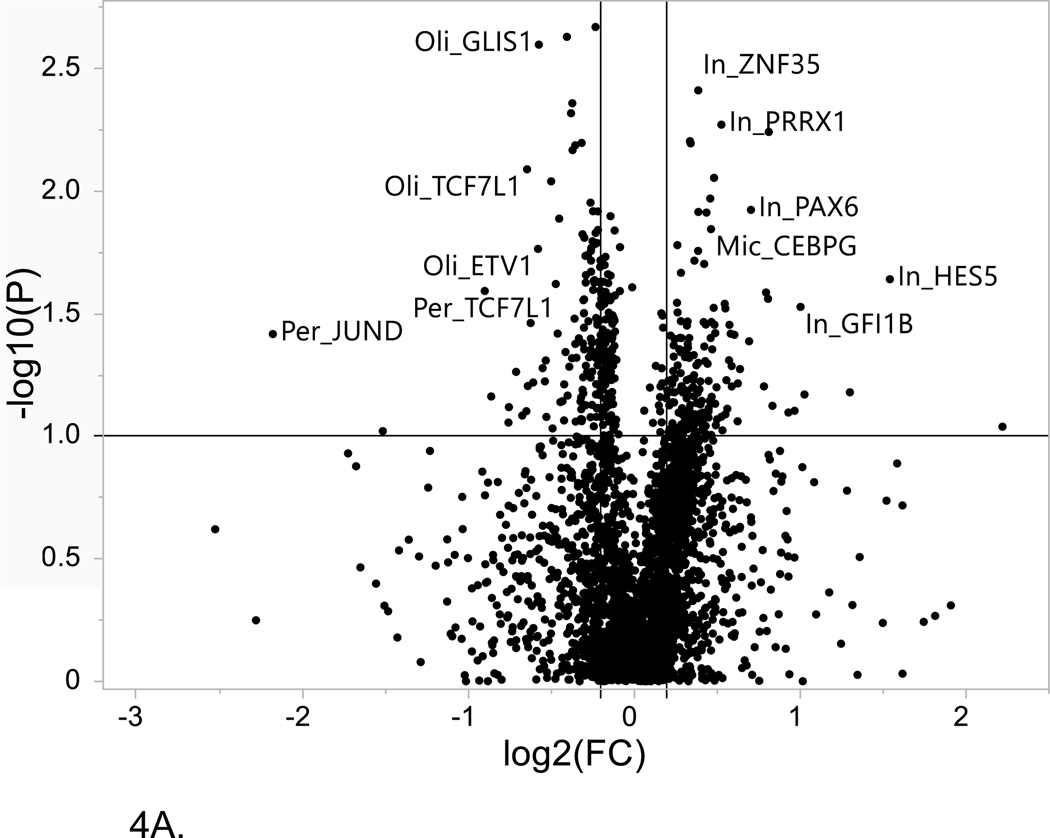
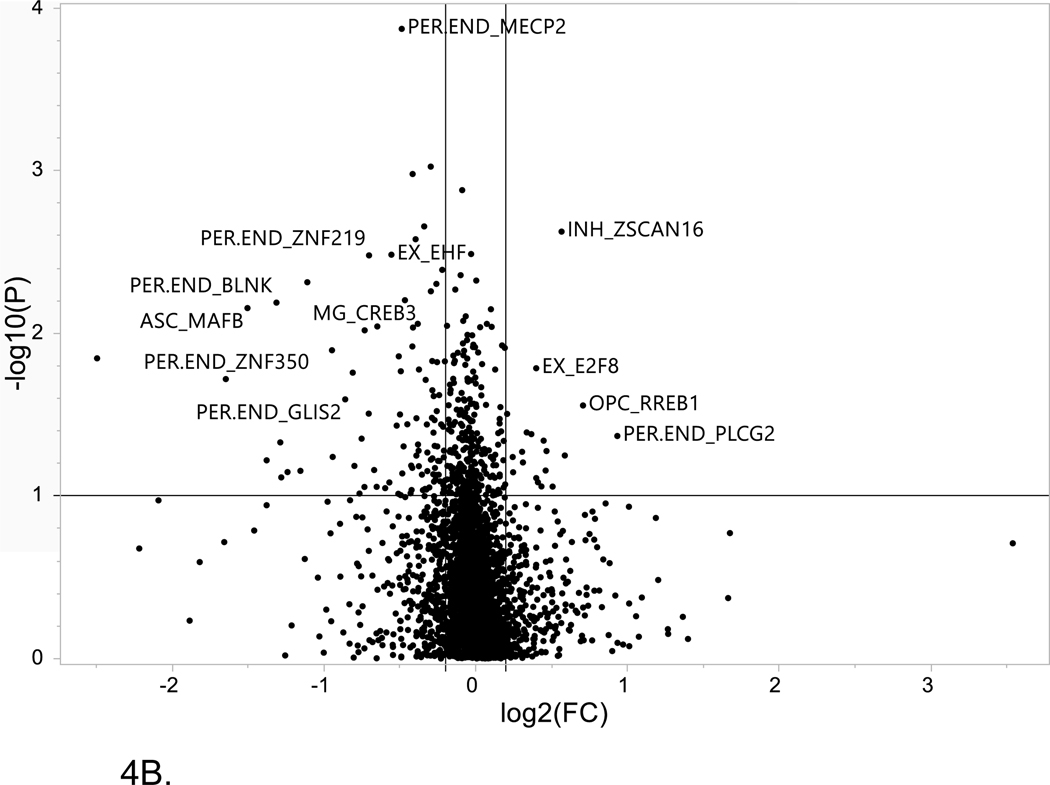
Figure 4. Volcano plot of single cell LOAD data.
This plot is based on the fold change differences in the snRNA-seq data for the genes and transcription factors identified in the bioinformatics analysis for all of the LOAD GWAS regions. The fold change is calculated as the difference between late-stage AD (LOAD) and age-matched cognitively healthy controls (74–90+years old). The plot shows the relationship between fold change (log2 fold change (FC); horizontal axis) and FDR-adjusted statistical significance (−log10 (p value); vertical axis), respectively. The horizontal line corresponds to a cut-off of FDR P value ≤ 0.1, vertical lines correspond to log2 fold change thresholds of ± 0.2. (A) ROSMAP data analysis. Cell type abbreviations: Oli-oligodendrocytes, In-inhibitory neurons, Mic-microglia, Per-pericytes (B) Sample analysis from Morabito et al. data[40] Cell type abbreviations: INH-inhibitory neurons, EX-excitatory neurons, ASC-astrocytes, MG-microglia, PER-END-pericytes/endothelial cells, OPC-oligodendrocyte progenitor cells.


