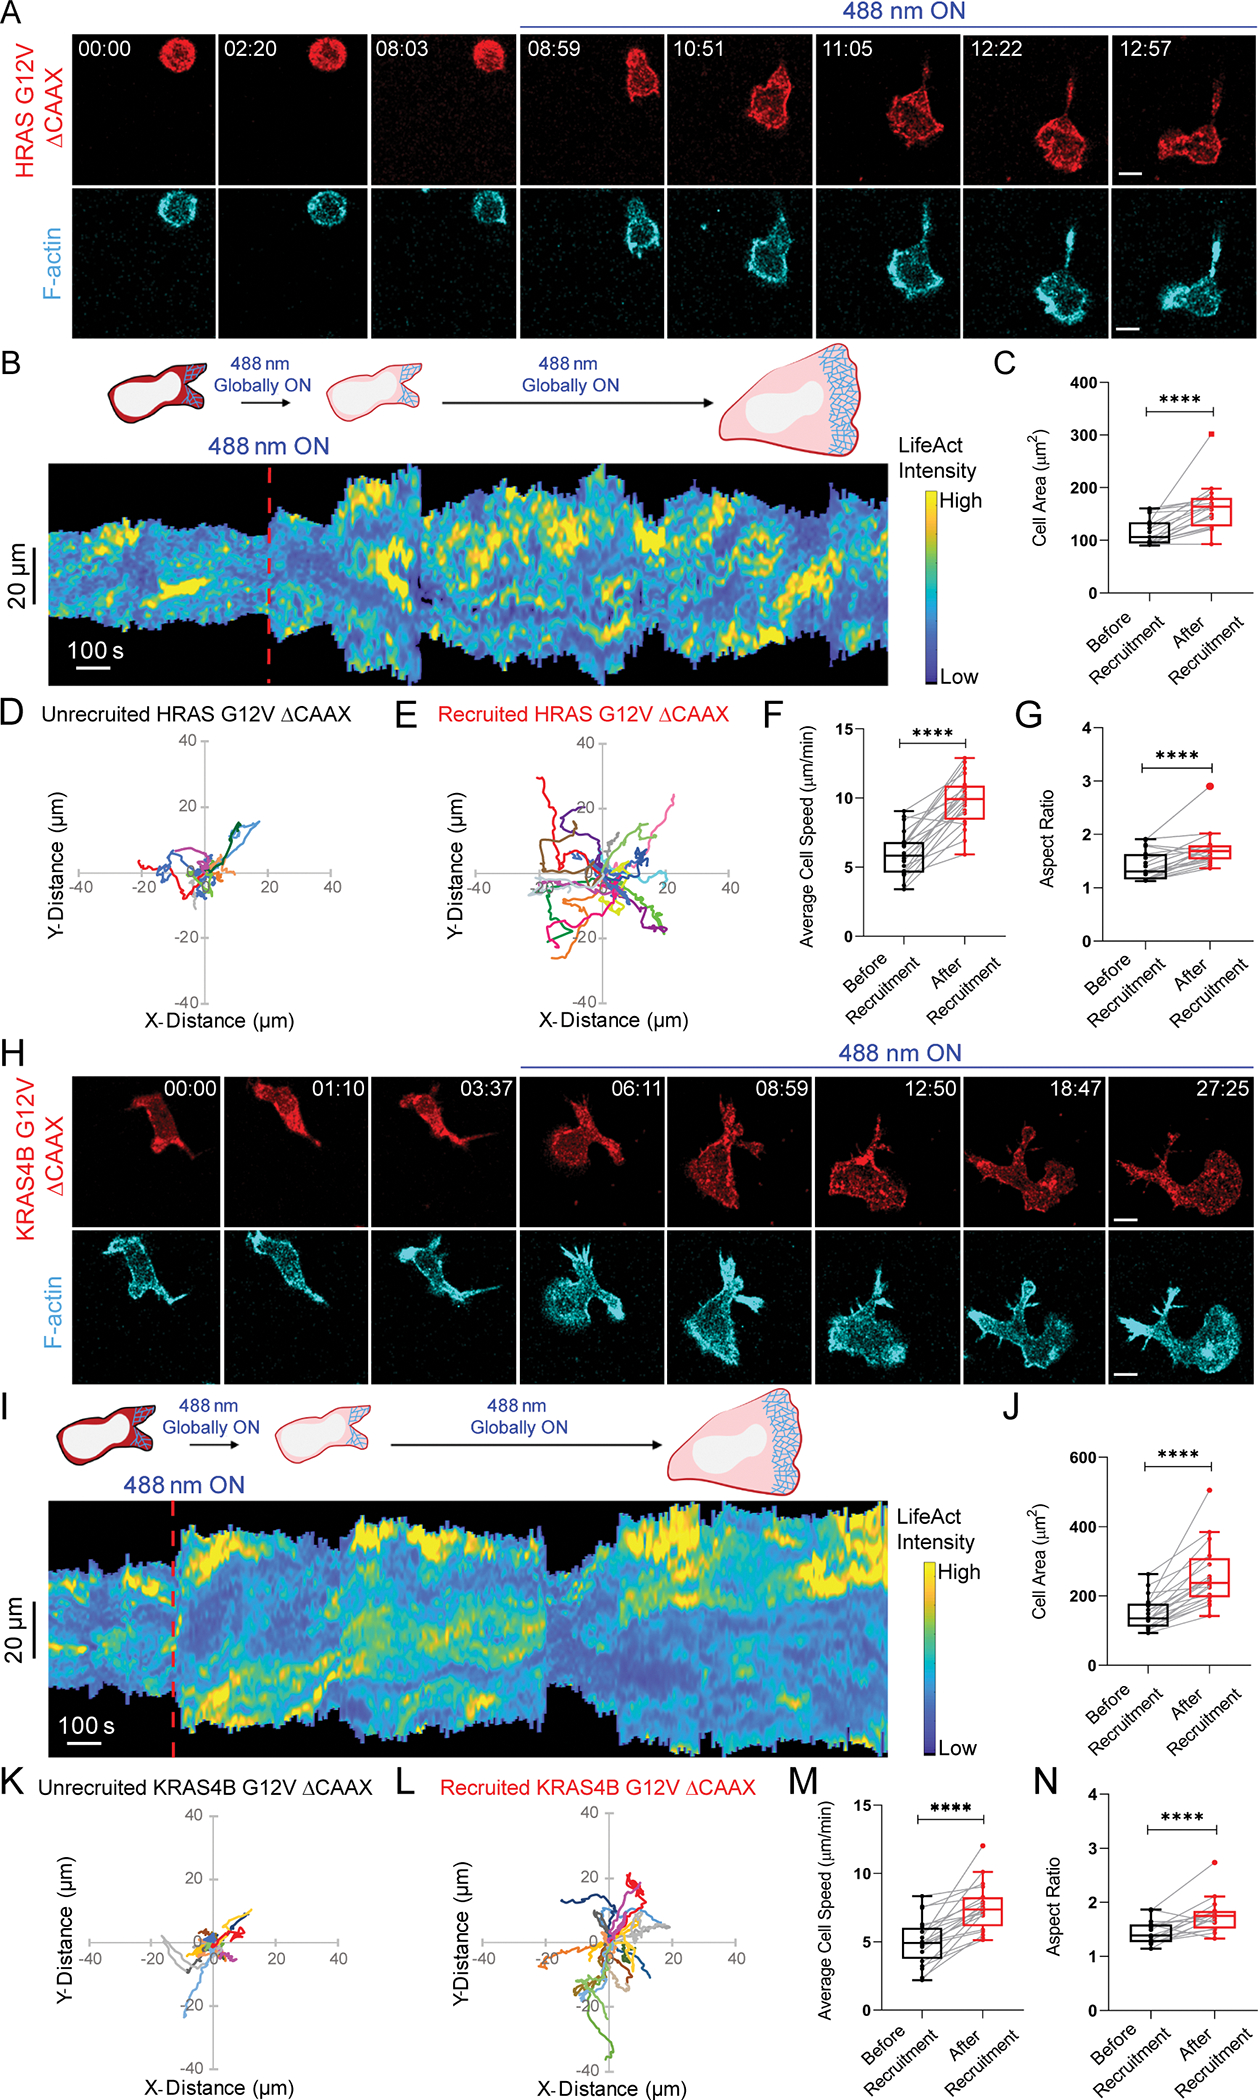
Figure 1. Global recruitment of constitutively active Ras isoforms improves neutrophil polarity and migration.

Confocal images of differentiated HL-60 neutrophil expressing (A) CRY2PHR-mcherry2-HRas G12V ΔCAAX or (H) CRY2PHR-mcherry2-KRas4B G12V ΔCAAX (red; upper panel) and LifeActmiRFP703 (cyan; lower panel), before or after 488 nm illumination. Time in min:sec format; scale bars 5 μm. (B, I) Representative kymographs of cortical LifeAct in cells of A and H. Cartoon depicts recruitment, F-actin polymerization, or cell shape status corresponding to the kymographs. Box-and-whisker plots of (C, J) cell area, (F, M) average speed, and (G, N) aspect ratio, before (black) and after (red) HRas G12V ΔCAAX or KRas4B G12V ΔCAAX recruitment. Centroid tracks of neutrophils showing random motility (D, K) before and (E, L) after HRas G12V ΔCAAX or KRas4B G12V ΔCAAX recruitment. Each track lasts at least 5 mins and was reset to same origin. nc=19 (HRas G12V ΔCAAX) or nc=20 (KRas4B G12V ΔCAAX) from atleast 3 independent experiments; asterisks indicate significant difference, ****P ≤ 0.0001 (Wilcoxon-Mann-Whitney rank sum test). See also Figures S1–S2.
