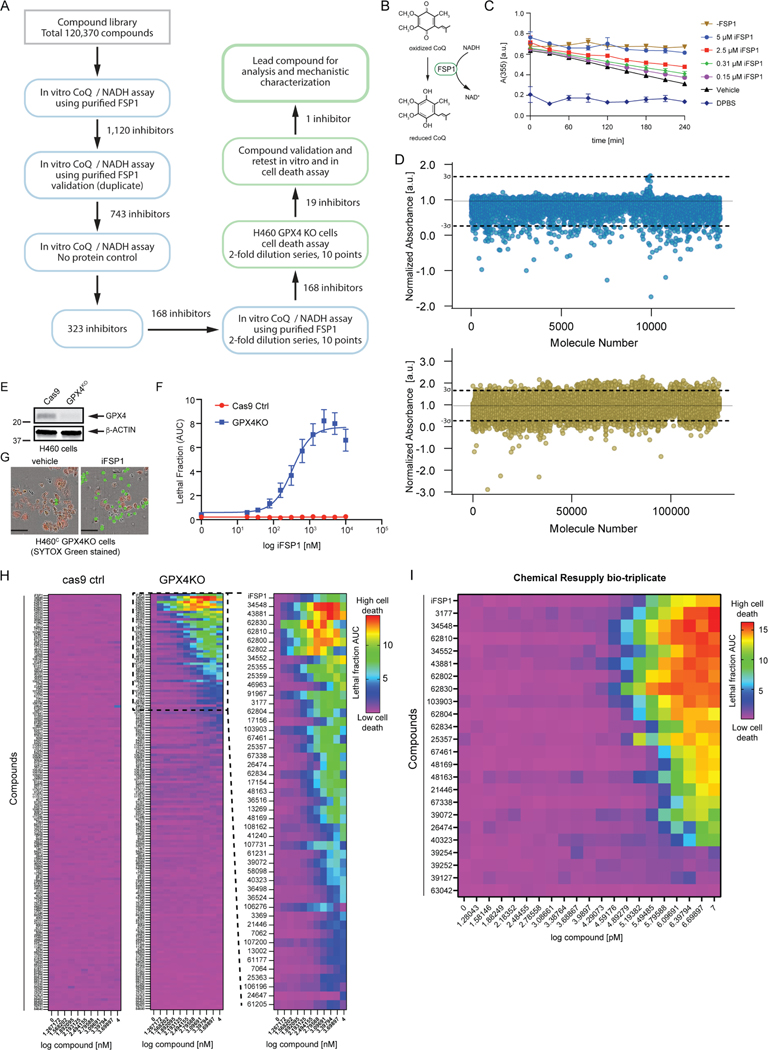
Figure 1. Small molecule screens identify FSP1 inhibitors.
A) Flow chart of the chemical screens and experimental validation employed to identify FSP1 inhibitors. B) Schematic of the in vitro activity assay using purified recombinant FSP1. C) FSP1 activity was measured using NADH absorbance in the presence of increase amounts of iFSP1. Mean ± SEM of three technical replicates. D) Scatter plots of 15,000 antibacterial compounds and 100,000 diverse + 5,370 FDA and Bioactive compounds assayed with in vitro absorbance-based assay of FSP1 activity. “Hits” are defined by a normalized absorbance value of <0.267. Dashed lines represent SD of 3-sigma cutoff defined by activity range of vehicle and No Protein control. E) Western blot analysis of H460C Cas9 and GPX4KO cells. F) Representative images of H460 GPX4KO cells treated with vehicle and iFSP1. Dead cells are marked with SYTOX Green. Scale bar represents 50 μm. Images from one of three independent experiments are shown. G) Dose response of iFSP1 induced cell-death in H460C Cas9 and GPX4KO cells. Lethal fraction was calculated by IncuCyte quantification of the ratio of dead cells over the total amount of cells over 24 hr. The mean ± SEM bars represent three biological replicates. H) Lethal fraction (AUC) was calculated in H460C Cas9 and GPX4KO cells incubated with increasing doses of 168 small molecules that inhibited FSP1 in vitro. The heat map reflects n=3 cell biological replicates. I) Lethal fraction was calculated H460C GPX4KO cells incubated with increasing doses of the most potent 19 FSP1 inhibitors and iFSP1. Resupplied, validated small molecules were used. The heat map reflects n=3 cell biological replicates.

