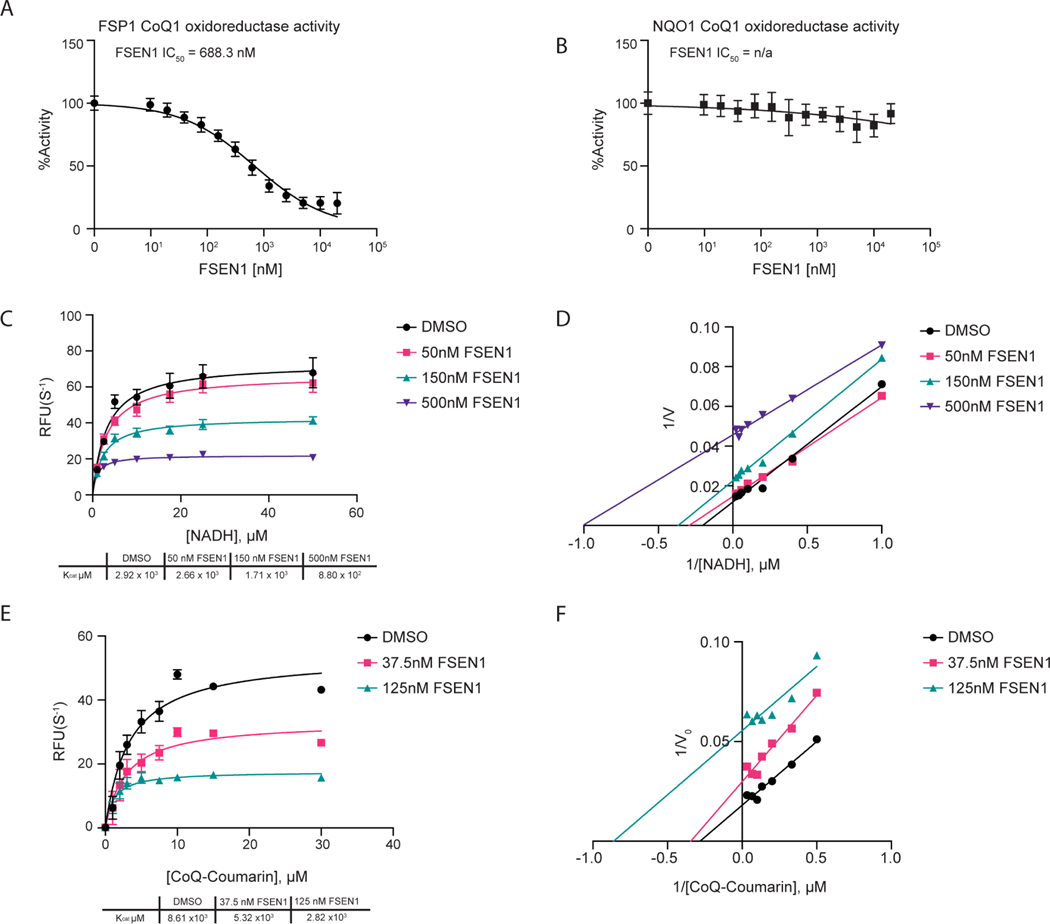
Figure 3. Mechanisms of inhibition of FSP1 by FSEN1.
A,B) Purified recombinant FSP1 (A) and NQO1 (B) CoQ1 oxidoreductase activities were measured in the presence of increasing concentrations of FSEN1. Data was normalized to the slopes calculated from DMSO and No Protein controls. IC50 values displayed in nM were calculated from a non-linear regression curve fit. Data are mean ± SEM bars (n=3 independent biological replicates). C,D) Michaelis-Menten and Line Weaver-Burk plots of FSP1 treated with increasing concentrations of NADH in the presence of vehicle or FSEN1. 10 μM CoQ-Coumarin was used as the co-substrate for FSP1, and reduced CoQ-Coumarin fluorescence was measured as a read-out of enzymatic product formation. Error bars represent linear regression standard error of initial rates taken from three biological replicates. Vmax and Km were calculated from the non-linear regression curve fit. E,F) Michaelis-Menten and Line Weaver-Burk plots of FSP1 treated with increasing concentrations of CoQ-Coumarin in the presence of vehicle or FSEN1. 200 μM NADH was included as a co-substrate for FSP1, and reduced CoQ-Coumarin fluorescence was measured as the read-out of enzymatic product formation. Error bars represent linear regression standard error of initial rates (n=3 independent biological replicates). Vmax and Km were calculated from the non-linear regression curve fit.

