
Figure 2.
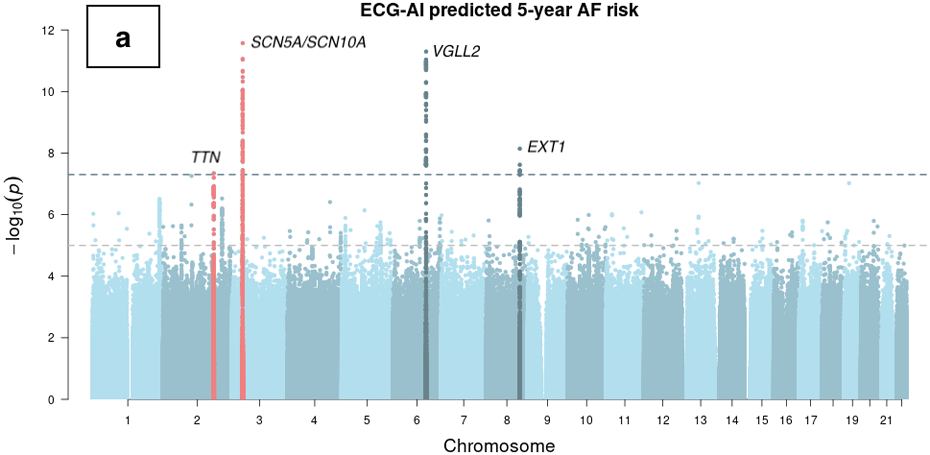
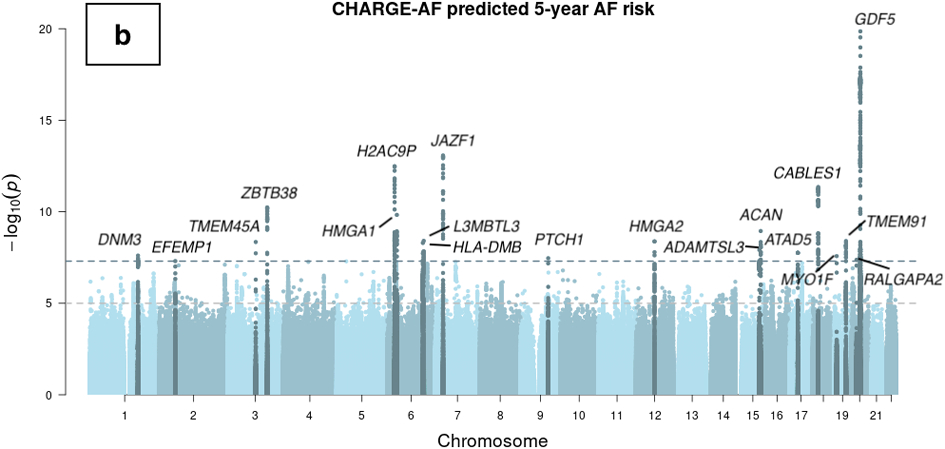
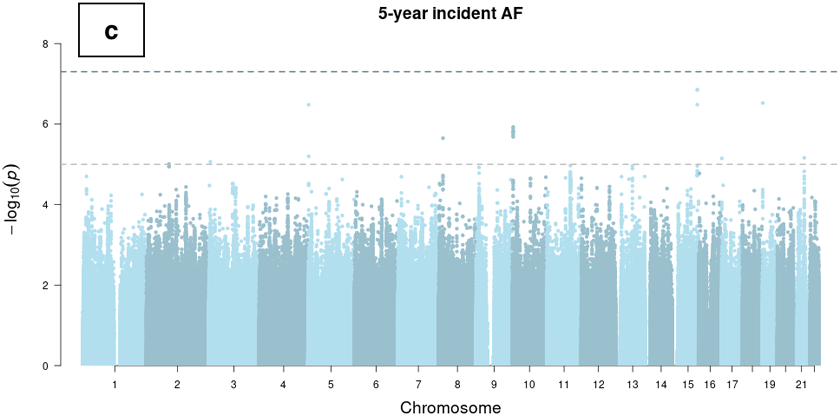
Manhattan plots of genome-wide association studies of ECG-AI and CHARGE-AF predicted risk of AF, and observed 5-year incident AF in the UK Biobank. Chromosomal variant positions are plotted on the x-axis. The −log10(P values) are plotted on the y-axis. The genome-wide significance threshold (5×10⁻⁸) is indicated by the horizontal dotted line. Variants are colored red near loci that have been reported in a prior atrial fibrillation (AF) GWAS,21 and are colored dark blue near loci that have not been reported previously in association with AF. Panels display associations with (a) ECG-AI predicted 5-year risk of AF, (b) CHARGE-AF predicted 5-year risk of AF, and (c) observed incident AF at 5-years in the UK Biobank. 5-year AF risk estimates were rank-based inverse normal transformed prior to analysis (see text).