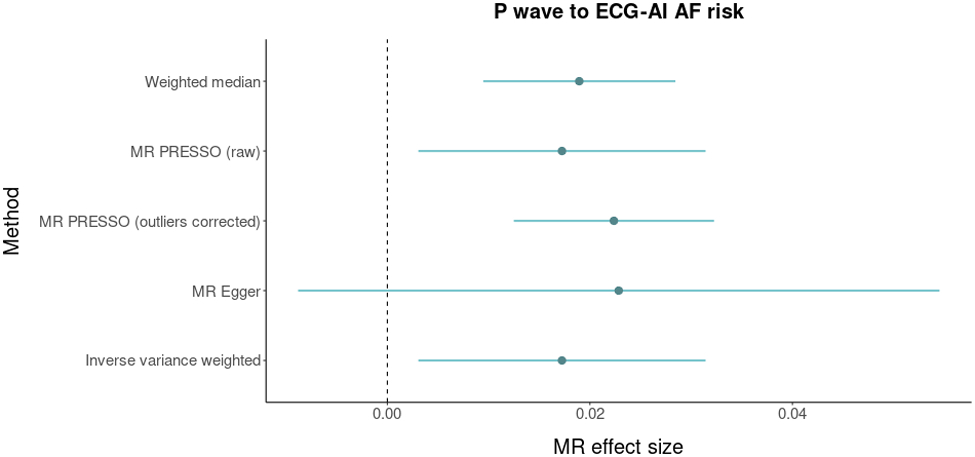
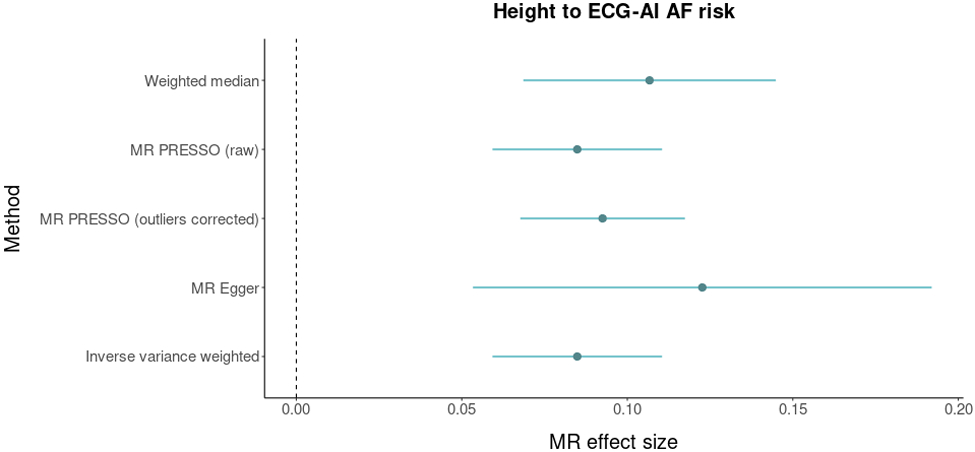
Figure 4.


Mendelian Randomization analysis between P wave duration, body height, and atrial fibrillation (AF). The figure displays Mendelian randomization results assessing ECG P wave duration (top panel) and body heigh (bottom panel) for relations with genetically predicted ECG-AI risk. Mendelian randomization effect sizes are graphed on the x-axis. Dots represent point estimates and bars represent 95% confidence intervals. Dashed gray lines represent zero effect sizes. The five Mendelian randomization methods used in this analysis are shown in the y-axis.
