
Figure 2: FrSBe T-scores at 1-Year Follow-up for Blast Mild TBI and Non-blast Controls.
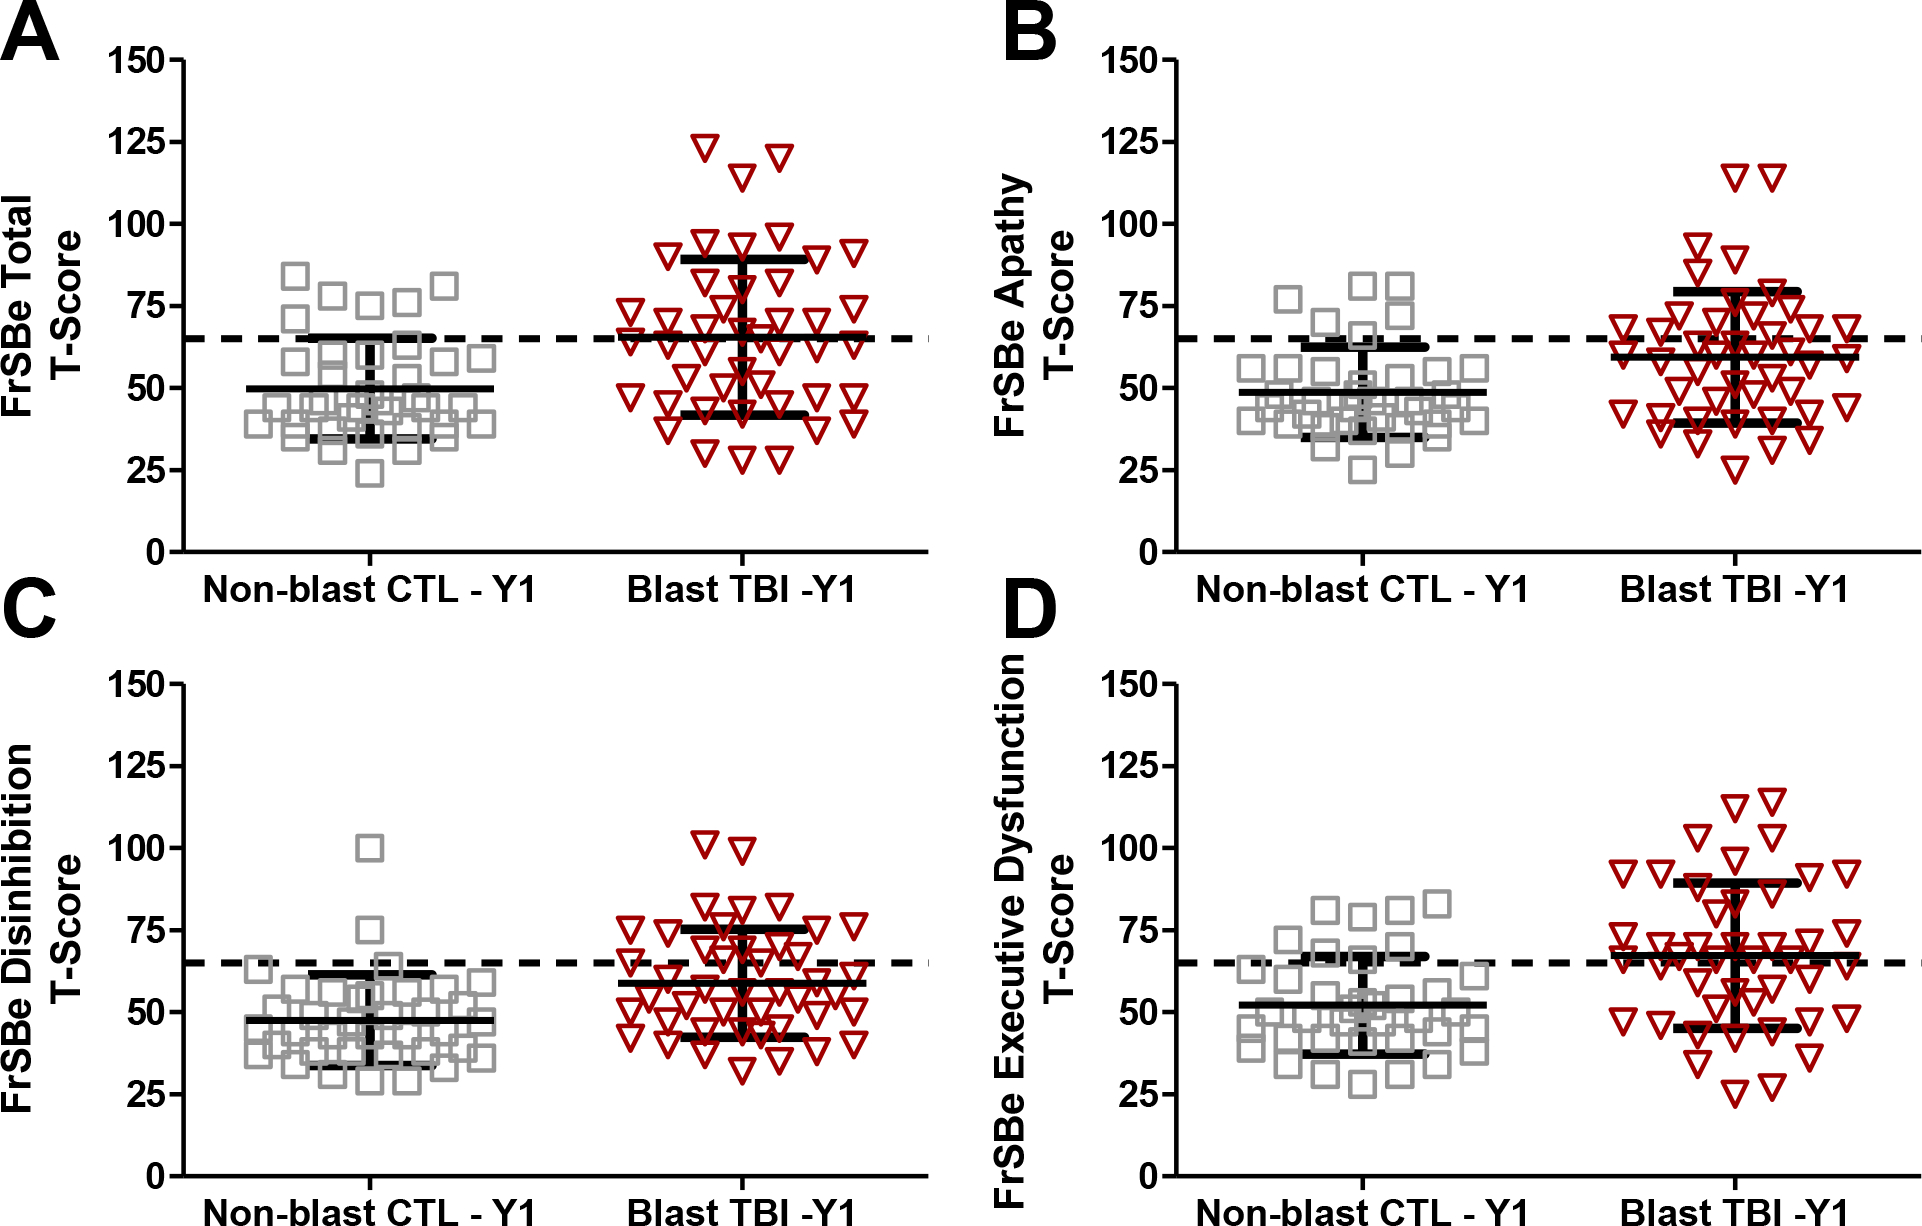
Note. A) FrSBe Total T-scores; p=.001. B) FrSBe Apathy T-scores; p=.007. C) FrSBe Disinhibition T-scores; p=.001. D) FrSBe Executive Dysfunction T-scores; p=.001.
Dashed horizontal line = Clinical elevation threshold of T>65