

Abstract
Background:
Sex differences in Parkinson’s disease (PD) risk are well-known. However, the role of sex chromosomes in the development and progression of PD is still unclear.
Objective:
The objective of this study was to perform the first X-chromosome–wide association study for PD risk in a Latin American cohort.
Methods:
We used data from three admixed cohorts: (1) Latin American Research consortium on the Genetics of Parkinson’s Disease (n = 1504) as discover cohort, and (2) Latino cohort from International Parkinson Disease Genomics Consortium (n = 155) and (3) Bambui Aging cohort (n = 1442) as replication cohorts. We also developed an X-chromosome framework specifically designed for admixed populations.
Results:
We identified eight linkage disequilibrium regions associated with PD. We replicated one of these regions (top variant rs525496; discovery odds ratio [95% confidence interval]: 0.60 [0.478–0.77], P = 3.13 × 10⁻⁵ replication odds ratio: 0.60 [0.37–0.98], P = 0.04). rs5525496 is associated with multiple expression quantitative trait loci in brain and non-brain tissues, including RAB9B, H2BFM, TSMB15B, and GLRA4, but colocalization analysis suggests that rs5525496 may not mediate risk by expression of these genes. We also replicated a previous X-chromosome–wide association study finding (rs28602900), showing that this variant is associated with PD in non-European populations.
Conclusions:
Our results reinforce the importance of including X-chromosome and diverse populations in genetic studies.
Keywords: admixed populations, hipanic/latino, Parkinson’s disease, underrepresented populations, x-chromosome wide association study
Introduction
Parkinson’s disease (PD) is the most common movement disorder and the second most common neurodegenerative disease.1,2 PD has an estimated prevalence of 1 to 2 per 1000 individuals and affects about 1% of the population older than 60 years.2 Although no singular definite answer lies behind the etiology, there is substantial evidence that PD develops from multiple factors, including genetics, age, sex, and environmental factors. The multifactorial nature of PD leads to variable clinical manifestations and response to treatment among individuals.
Sex is an important factor, not only in the development but also in the progression of PD. Studies have shown that PD affects males more frequently than females, although a recent meta-analysis showed that this difference in prevalence can be lower than expected and is population specific.3 Biological aging differs distinctly between males and females because of hormonal and immunological changes that females specifically experience,4–6 and this may contribute to the stark differences observed in PD risk, presentation, severity, and treatment success.7 Even though estrogen is thought to have a protective role in PD risk,8–10 this remains unclear, because multiple studies contradict this hypothesis.11–14 Currently, there is a huge gap in information about the cause of these differences in incidence and manifestation, including the impact of factors related to women’s health (pregnancy, menses, etc.) on the development and progression of PD.15
Aside from sex, genetics plays a large role in PD. Genome-wide association studies (GWASs) have identified close to 100 low-penetrance variants associated with PD.16,17 However, much of what we know about the genetic architecture of PD is based on European and Asian populations, leading to a limited understanding in other populations, such as Latin Americans,18 who are the product of intensive admixture during the last 500 years between Africans, Europeans, and Native Americans. The Latin American Research Consortium on the Genetics of PD (LARGE-PD), an ongoing effort of more than 40 institutions in 14 countries across the Americas and the Caribbean, was formed to address this gap. We recently performed the first PD GWAS19 and polygenic risk score analyses20 in our highly admixed Latin American cohort.
Although the GWAS approach has been instrumental in the field, the genetic associations found for PD risk have been derived from autosomal variants. The exclusion of the sex chromosomes in GWAS, especially the X-chromosome (X-chr), is very common due to the challenges (eg, poor array coverage, complex statistical analyses, etc.) that are not present for autosomal chromosomes. However, the X-chr has about 155 Mb of DNA and includes about 5% of the entire genome.21,22
The differences in prevalence between sexes, combined with studies that did not find significant genetic differences in autosomal chromosomes between PD cases in males and females,23 led to the hypothesis that genetic variants on the X-chr could explain these differences between males and females. To test this hypothesis, Le Guen et al24 performed the first X-chr–wide association study (XWAS) in PD. This study identified two significant loci, one of which (rs28602900) was replicated in an independent cohort when analyzing males and females together, but it found no sex-specific variants. Although this study paved the way for a better understanding of the role that the X-chr may play in PD etiology, it included only individuals of European ancestry, leaving our understanding uncertain of the role of the X-chr in other populations.
In this article, we show the results of the first-ever XWAS for PD in a highly diverse and admixed cohort, composed of 1498 individuals from five countries in Latin America as part of LARGE-PD, and we used an independent cohort of 1577 admixed Latin American individuals to replicate our results.
Methods
Samples
Discovery Cohort: LARGE-PD Dataset
For the discovery cohort, we included 1498 individuals from Brazil, Chile, Colombia, Peru, and Uruguay recruited as part of LARGE-PD. This cohort has a mean age of 59.3 ± 13.9 years, with 55.7% being females. After excluding all samples with missing data (n = 17), our dataset was composed of 798 cases (374 females) and 683 control subjects (453 females). A detailed description of LARGE-PD and genotyping was provided by Loesch et al19 in 2021.
We carried out the analysis using all individuals together (LARGE-ALL, n = 1481), as well as by each LARGE-PD subcohort: Brazil (n = 223), Chile and Colombia (n = 359), Peru (n = 710), and Uruguay (n = 189). We merged Chile and Colombia because of Chile having only cases and Colombia being a population with a similar ancestry background based on principal-component analysis (PCA) and ADMIXTURE inferences.19,25
Replication Cohort: International Parkinson Disease Genomics Consortium and the Bambuí Cohort of Aging
For our replication cohort, we combined two independent cohorts, one from the International Parkinson Disease Genomics Consortium (IPDGC) and the other the Bambuí Aging Cohort Study.26 The IPDGC Latino cohort included 155 samples, 117 cases (44 females), and 38 controls (22 females) (age unavailable), ethnically matched with LARGE-PD and genotyped with the Illumina NeuroChip Array.27
This IPDGC cohort was combined with data from the Bambuí to increase the sample size. The Bambuí dataset is composed of 1422 individuals, representing 82% of the residents in the city of Bambuí (Brazil) older than 60 years old at the baseline year (1997).28 A detailed description of the Bambuí cohort and genotyping can be seen in Kehdy et al.28
To include the Bambuí dataset, we calculated the autosomal PCA for the IPDGC + Bambuí with European and African populations from 1000 Genomes (YRI and IBS, respectively29) and Native American (dataset from the Tarazona Lab28) as parental references. After this, we calculated the mean and standard deviation (SD) for IPDGC samples for the first 10 PCs and removed all Bambui individuals who were ±2 SD from the IPDGC mean in any PC. The Bambuí cohort contains mostly healthy controls but also a few idiopathic PD subjects.30 In our study we included 10 idiopathic PD subjects as cases. Individuals without PD diagnosis were added as controls (275 males, 509 females).
Together, our replication cohort included 949 individuals, of which 127 are cases (48 females) and 822 controls (531 females). Details about the IPDGC + Bambuí dataset can be found in the Supporting Information (see Bambuí sample selection section).
Quality Control, Admixture Analysis, and Imputation
Basic Quality Control
We first performed a basic quality control (QC) procedure (Supporting Information Fig. S1) using PLINK v1.90,31 in which we removed unaligned, 100% heterozygous, and ambiguous variants for the discovery and replication cohorts. Next, we excluded variants and individuals with more than 10% missing data, split the pseudoautosomal data from X-chr, and removed individuals whose genetic sex, inferred by PLINK, differed from the self-reported sex. Furthermore, we changed the reference genome from hg37 to hg38 using an in-house script.
Le Guen et al’s 2021 QC Process
As reference, we used the QC and harmonization pipeline that Le Guen and collaborators24 developed, but we implemented some modifications because their pipeline was specific for a homogeneous ancestry cohort, and LARGE-PD consists of highly admixed individuals.
To apply the Le Guen et al24 pipeline to a non-homogeneous population and mitigate the risk for false positives caused by population structure, our pipeline was composed of three main steps: (1) autosomal QC (Supporting Information Fig. S2), (2) X-chr QC (Supporting Information Fig. S3), and (3) population structure analysis (Supporting Information Fig. S4). The differences will be explained in each step.
Autosomal QC.
First, we removed individuals with missing covariates and variants that are: (1) located in structural variants using TriTyper,32 (2) duplicated, (3) monomorphic, (4) potential probe sites (defined as variants in which the probe may have variable affinity because of the presence of other Single Nucleotide Polymorphisms (SNPs) within 20 bp and with Minor Allele Frequency (MAF) >1%), or (5) have failed the Hardy–Weinberg equilibrium exact test (P < 10−5 in controls). Next, we (6) removed individuals with >10% of genetic missing data and (7) variants >5% of missing data, followed by the (8) inference of the relatedness between included individuals using KING33; those at greater than a second-degree level (kinship coefficient > 0.0884) were removed using NAToRA34 (Supporting Information Fig. S2). Unlike the Le Guen et al24 pipeline, samples were not removed based on ancestry.
X-Chr QC.
We removed any individual excluded in the autosomal QC step and performed the same steps from the autosomal QC on X-chr variants, except for the relatedness calculation and removal. Specific to the X-chr, we removed variants if they (1) were heterozygous variants in males, (2) had differential missingness between cases and controls (P < 10−5), (3) failed the Hardy–Weinberg equilibrium exact test (P < 10−5) in the female controls, and (4) had differential missingness and MAF between males and females (P < 10−5). Next, we set males as hemizygous and phased our data using 1000 Genomes Project29 as reference and the flags “-allowRefAltSwap keepMissingPloidyX” in Eagle (v2.4.1)35 (Supporting Information Fig. S3).
We performed all QC steps described for Brazil, Chile + Colombia, Peru, Uruguay, LARGE-ALL, and IPDGC + Bambui.
Imputation
Imputation for all cohorts was done with the TOPMed Imputation Server36 and a local version of the TOPMed Imputation Panel using a subset of Freeze 10b.37 After a pilot test, we opted to use the local version because the results were slightly better than those obtained with the Imputation Server. We also compared the imputation quality between autosomal and X-chr and observed a decrease in imputation quality for the X-chr compared with the autosomal (Supporting Information Fig. S5, Supporting Information Table S1). We chose to use only variants with a high imputation quality score (r2 > 0.8). More details about the imputation tests can be found in the Supporting Information (see Imputation Tests section).
Population Structure Control
For population structure control, we used X-chr PCA (X-PCA) instead of the autosomal PCA because of the low correlation between them (see Supporting Information X-Chromosome Principal Component Analysis section).
We performed 10 X-PCAs using the QCed genotyped data using the GENESIS package,38 and we removed all outlier samples, defined as ±3 SD in any PC for males and females. We then merged non-outlier males and females to generate the Both dataset (males and females combined). With this new dataset, we performed the X-PCA and removed outliers from the Both dataset (Supporting Information Figs. S4, S6). The number of samples and variants per dataset are presented in Table 1.
Table 1.
Information about the different databases used in this study
| Analysis Cohort | Discover Phase |
Replication Phase |
|||||
|---|---|---|---|---|---|---|---|
| Brazil | Chile and Colombia | Peru | Uruguay | LARGE-ALL | IPDGC + Bambuí | ||
|
| |||||||
| No. of variants | Genotyped | 15,831 | 16,109 | 14,844 | 14,388 | 17,860 | 3,599 |
| Genotyped and imputed | 562,354 | 634,449 | 438,816 | 474,046 | 763,375 | 373,270 | |
| Males | No. of samples | 102 | 152 | 288 | 62 | 576 | 260 |
| No. of cases | 87 | 68 | 214 | 23 | 375 | 72 | |
| PVT genotyped | 3.73E–04 | 3.10E–04 | 1.47E–04 | 3.56E–05 | 1.00E–04 | N/A | |
| PVT imputed | 3.22E–04 | 2.77E–04 | 1.15E–04 | 2.33E–05 | 6.65E–05 | N/A | |
| Females | No. of samples | 95 | 172 | 364 | 108 | 754 | 345 |
| No. of cases | 47 | 79 | 184 | 24 | 340 | 34 | |
| PVT genotyped | 4.70E–04 | 3.18E–04 | 2.22E–04 | 4.20E–05 | 1.46E–04 | N/A | |
| PVT imputed | 4.26E–04 | 2.99E–04 | 2.31E–04 | 3.99E–05 | 1.33E–04 | N/A | |
| Both | No. of samples | 175 | 295 | 602 | 149 | 1,193 | 544 |
| No. of females | 73 | 144 | 314 | 87 | 618 | 284 | |
| No. of cases | 117 | 138 | 370 | 42 | 658 | 100 | |
| PVT genotyped | 3.31E–04 | 2.37E–04 | 1.58E–04 | 3.28E–05 | 1.10E–04 | N/A | |
| PVT imputed | 3.30E–04 | 2.41E–04 | 1.77E–04 | 3.08E–05 | 8.43E–05 | N/A | |
Note: We calculated the number of independent tests and the PVT for each dataset. We use the smallest value as the LARGE-Meta cutoff.
Abbreviations: IPDGC, International Parkinson Disease Genomics Consortium; PVT, P value threshold.
Association Study
Differences in allelic frequencies caused by historical/demographic variation could increase our false-negative or false-positive results. Due to our small sample size, to avoid a significant loss in statistical power for the association analyses, we used two approaches. To ensure the largest sample size possible for analyses, we used the LARGE-ALL dataset, whereas to control for the risk of heterogeneity caused by historical/demographic events, we used a meta-analysis approach, called here LARGE-Meta.
For LARGE-ALL, we merged the five subcohorts and performed all the QC steps, imputation, population structure control, and regression in a single run. For LARGE-Meta, we first performed the QC steps, imputation, population structure control, and regression by subcohort followed by a meta-analysis using the GWAMA software39 (Supporting Information Fig. S7).
For all datasets, we performed regression for three datasets: (1) male, (2) female, and (3) both (regression with males and females merged). We also performed a meta-analysis using sex-differentiated and sex heterogeneity implemented on GWAMA,39 called Male+Female by Le Guen and collaborators24 (Supporting Information Fig. S6).
All regression analyses were performed using Firth’s logistic regression in PLINK2.40 In each of our models, we used age (when available), sex, and X-PCs as covariates. Sex-stratified analysis involved PC1 to PC10, whereas for the Both dataset we used PC2 to PC10. In the Both dataset, PC1 separates males and females. We used the PLINK2 default X-chr coding (males and females are both on a 0–2 scale).
We also performed a meta-analysis using sex-differentiated and sex heterogeneity implemented on GWAMA with LARGE-PD datasets (Brazil, Chile and Colombia, Peru, Uruguay, and IPDGC + Bambui) and Le Guen and collaborators’ dataset. We just considered variants that were present in, at least, half of the studies.
X-Chromosome P Value Threshold
We calculated the X-chr P value threshold (PVT) (Table 1) based on the number of independent tests for each dataset (see Supporting Information X-Chromosome Significance Threshold section). We did not use the GWAS PVT (P < 5 × 10⁻⁸) because the genome-wide analysis has more independent tests than the X-chr analysis.
Gene Expression Studies
We extracted the top variants from replicated regions and used the GTEx Portal41 to identify the genes for which these variants may act as expression Quantitative Trait Loci (eQTL). We built a list with all eQTLs searching the rs ID in the portal (https://gtexportal.org/home/), and all genes present in the “Single-Tissue eQTLs” section were included in our list of genes.
After this, we accessed through AMP-PD (https://amp-pd.org/transcriptomics-data) the whole-blood time progression gene expression data (gencode v29) from Parkinson’s Progression Markers Initiative (PPMI; https://amp-pd.org/unified-cohorts/ppmi) and extracted the RNA counts for our list of genes from baseline point (0 month time point).
To investigate whether our variants are associated with differences in gene expression, we used a t test to assess whether there was a statistical difference between the RNA counts of cases and controls segregating by sex and self-reported ethnicity (Hispanic or Latino and non-Hispanic or Latino).
Based on the replicated variants, we also conducted Approximate Bayes Factor colocalization analyses focusing on brain tissues with significant QTL associations on GTEx v8 under a single causal variant assumption method provided by the R package coloc.42 This analysis assesses the posterior probability of the variants being the causal variant for both traits (GWAS summary statistics and eQTL data).
Results
Association Results
The association study demonstrated that 86 candidate variants were significantly associated based on the X-chr PVT (Fig. 1, Supporting Information Fig. S8, Table 2, Supporting Information Tables S2–S5).
FIG. 1.
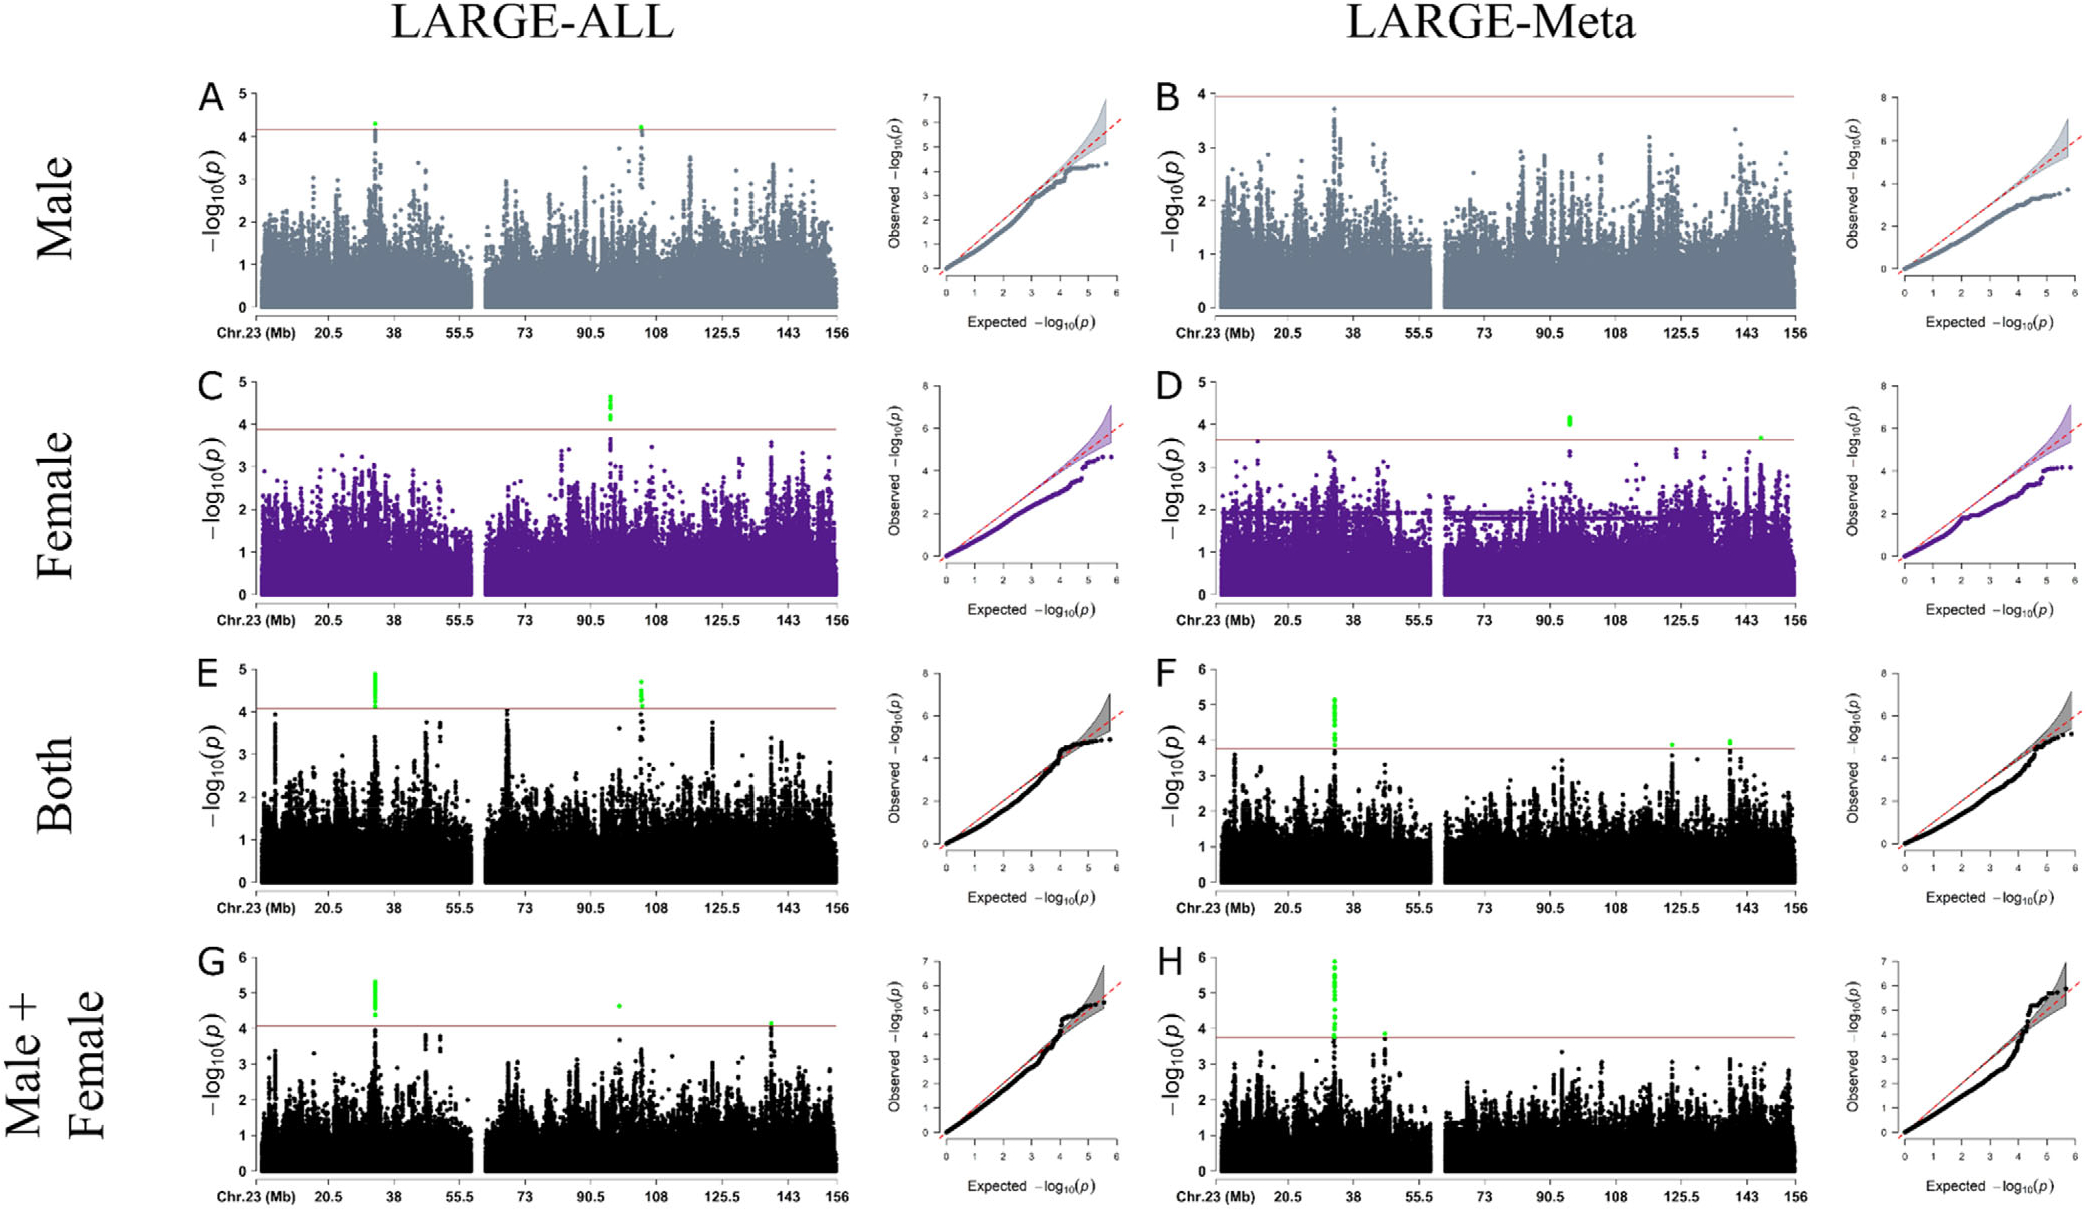
Results from X-chromosome–wide association study in LARGE-PD dataset for the discovery phase using LARGE-ALL (left) and LARGE-Meta (right). Each panel shows the Manhattan and Q-Q plot for Males (A, B), Females (C, D), Both (E, F), and Male+Female (G, H). The significance threshold was calculated based on the number of independent tests. Because we were not able to calculate the cutoff value for the LARGE-Meta, we opted to use the same cutoff value for the Both dataset.
Table 2.
Variants discovered and/or replicated in our work.
| rs ID | Position | Discover |
IPDGC + Bambui |
Le Guen et al24 |
||||||||||
|---|---|---|---|---|---|---|---|---|---|---|---|---|---|---|
| Analysis | Sex | OR | 95% CI | P value | Sex | OR | 95% CI | P value | Sex | OR | 95% CI | P value | ||
|
| ||||||||||||||
| rs112103361 | 95820303 | ALL | F | 1.66 | 1.29, 2.12 | 2.25E–05 | M+F | 0.59 | 0.39, 0.89 | 0.01 | F | 1.01 | 0.96, 1.06 | 0.62 |
| rs525496 | 104021932 | ALL | B | 0.60 | 0.48, 0.77 | 3.13E–05 | M | 0.60 | 0.37, 0.98 | 0.04 | M | 0.99 | 0.95, 1.02 | 0.52 |
| rs945666 | 146850760 | META | F | 2.67 | 1.59, 4.48 | 2.08E–04 | M+F | 1.34 | 0.90, 1.99 | 0.14 | M + F | 1.03 | 1.00, 1.06 | 0.04 |
| rs28602900 | 154405192 | META | B | 1.41 | 1.06, 1.88 | 0.017 | M+F | 1.20 | 0.81, 1.82 | 0.35 | M + F | 1.10 | 1.06, 1.14 | 1.80E–08 |
Note: This table presents the lower P value for all sexes (M, F, B, and M+F), for all analyses (ALL and META) and datasets. The variants rs112103361 and rs525496 were discovered using the LARGE-PD dataset and replicated using IPDGC + Bambui. The variant rs945666 was discovered using the LARGE-PD dataset and replicated using Le Guen et al’s24 data. The rs28602900 variant was discovered in Le Guen et al’s data and replicated using the LARGE-PD dataset.
Abbreviations: ALL, LARGE-ALL; B, Both; CI, confidence interval; F, Female; IPDGC, International Parkinson Disease Genomics Consortium; M, Male; META, LARGE-META; M+F, Male+Female; OR, odds ratio.
We observed that the Females analysis was the most underpowered based on Quantile-Quantile (QQ) plots (Fig. 1C,D), even though it has more samples than the Males analysis. We hypothesized that this could be caused by the fact that female heterozygous variants could act as noise because we cannot infer what X-chr was inactivated in each cell. To test this hypothesis, we treated the heterozygous variants as missing data and performed the regression. In general, the inflation rate was better, but this resulted in the loss of ~60% of variants in all datasets because of an increase in the number of monomorphic variants (Supporting Information Fig. S9); thus, we decided against this approach.
Next, we analyzed all XWAS summary statistics in all four different datasets (Male, Female, Both, and Male+Female) using the LARGE-ALL dataset and LARGE-Meta approach. Using the LDMatrix43 and Admixed American Populations as reference, we then found the 86 variants identified in the association study to be in eight regions with high linkage disequilibrium (LD) (Supporting Information Fig. S10). All variants that reached statistical significance (Supporting Information Table S2–S5) have not been previously reported.
In the meta-analysis between Le Guen and collaborators’ data and LARGE-PD, we observed that the results are almost the same. No new variants reached the GWAS PVT (P < 5 × 10⁻⁸), but two new regions (top SNP: rs5970936 and rs1323742) reached GWAS suggestive P values (P < 1 × 10⁻⁵) in Females, and we lose one region in Males (Supporting Information Fig. S11).
Replications in Independent Cohorts
IPDGC + Bambui
Using the IPDGC + Bambuí dataset, 19 variants in two high LD regions achieved statistical significance: (1) chrX:103929276–104031236 (R2 > 0.617, D′ = 1) and (2) chrX:95074293–95823918 (R2 > 0.84, D′ = 1) (Table 2, Supporting Information Table S6).
The region chrX:103929276–104031236 (Supporting Information Fig. S12), represented by rs525496 (Supporting Information Fig. S13), was discovered in LARGE-ALL Both (odds ratio (OR) [95% confidence interval (CI)] 0.60 [0.48, 0.77], P = 3.13 × 10⁻⁵), and it was replicated in Males (OR [95% CI]: 0.60 [0.37, 0.98], P = 0.0421). Besides that, the P values for Both sex dataset on the replication cohort were near to the replication PVT (P value ranging between 0.062 and 0.088). The region includes three genes, TMSB15B, H2BW1, and H2BW2, and it is close to SLC25A53, FAM199X, and ZCCHC18 genes.
The region chrX:95074293–95823918 (Supporting Information Fig. S14), represented by rs112103361 (Supporting Information Fig. S15), is an intergenic region, and it was discovered in Male analysis in LARGE-ALL (OR [95% CI]: 1.65 [1.31, 2.08], P = 2.24 × 10⁻⁵) and LARGE-Meta (1.66 [1.29, 2.12], P = 6.8 × 10⁻⁵), and it achieved statistical significance in the replication cohort in Males (OR [95% CI]: 0.53 [0.32, 0.89], P = 0.017) and in Male+Female analysis (0.59 [0.39, 0.89], P = 0.012). However, the effect directions for the replication were opposite to those in the discovery results. For more information, see Supporting Information Replication With Opposite Effects section.
Le Guen et al
Using Le Guen et al’s24 results, we were able to replicate a variant from Le Guen et al (rs28602900), and we were able to replicate one of our variants (rs945666).
We replicated the variant discovered and replicated in Le Guen et al (rs28602900) with the same direction (Le Guen et al OR [95% CI]: 1.10 [1.06, 1.14], P = 1.8 × 10⁻⁸, LARGE-Meta Both OR [95% CI]: 1.41 [1.06, 1.88], P = 0.017) (Supporting Information Fig. S16). This variant is located in a high gene density region that includes RPL10, ATP6A1, FAM50A, and PLXNA3 and also was replicated in the original paper. The other variant, rs7066890, was not present in our dataset because of low imputation score (r2 < 0.8).
The variant rs945666 (Discovery LARGE-Meta Female OR [95% CI]: 2.67 [1.589, 4.4851], P = 2.08 × 10⁻⁴) was not replicated in the IPDGC+Bambuí dataset, but it achieved statistical significance in Le Guen et al’s24 results (Female: 1.05 [1.001, 1.104], P = 0.046, Male+Female: 1.03 [1.001, 1.06], P = 0.044) (Table 2). This variant is in an intronic region, and there is no eQTL associated with it.
Differences in RNA Expression on eQTL Genes
Leveraging single-tissue cis-QTL data from the GTEx v8 portal,41 we noted multiple expression QTL associations with rs525496 after multiple test correction, including TMSB15B, LL0XNC01–116E7.1, and GLRA4 in the cerebellum, and H2BFM in the nucleus accumbens (basal ganglia). Non-brain tissues showing similar eQTL associations with rs525496 include H2BFM (testis), FAM199X (pancreas), RAB9B (cultured fibroblasts), ZCCHC18 (aortic artery and pituitary), LL0XNC01–116E7.2 (subcutaneous adipose tissue, tibial nerve, cultured fibroblasts, and sun-exposed skin), LL0XNC01–240C2.1 (visceral adipose tissue), and again TMSB15B (tibial artery) (Supporting Information Table S7).
We downloaded the PPMI data for all mentioned genes, but only information for GLRA4, RAB9B, H2BFM, ZCCHC18, and FAM199X was available. After the t test, we observed statistical differences for GLRA4 in females in both ethnic groups and for RAB9B and H2BFM in non-Hispanic/Latinos in Females and Males (Supporting Information Fig. S17). However, PPMI has data for only 130 Hispanic/Latinos compared with 1139 non-Hispanic/Latinos.
Based on the colocalization analysis, we derived posterior probabilities for the eQTL region spanning these genes using the default prior probability of 1 × 10⁻⁴. No posterior probabilities >70% were identified, suggesting that rs525496 may not mediate PD risk through expression of any of these genes.
Discussion
GWASs frequently exclude analysis of the X-chr, resulting in a lack of understanding about the role in disease of ~5% of the human genome. In addition, population diversity has been inadequately represented in genetic studies, with most studies including only individuals of European ancestry.44,45 Both are true in PD, where only one XWAS has been performed, including only individuals of European ancestry.24 In this study, we performed the first XWAS for PD in a Latin American cohort and shared a novel pipeline for XWAS analysis in an ancestrally diverse population. We identified 86 variants with statistical significance across eight regions with high LD, and one region was fully replicated in an independent cohort.
The region chrX:103929276–104031236 was discovered in the Both dataset, and it was replicated in Males. This region has several genes: TMSB15B (thymosin beta 15B), H2BW1 (H2B histone family member W, Testis Specific), and H2BW2 (H2B histone family member M), and it is near SLC25A53 (solute carrier family 25 Member 53), ZCCHC18 (zinc finger CCHC-type containing 18), and FAM199X (family with sequence similarity 199, X-linked).
Moreover, analysis of the GTEx v8 initiative indicated that the top hit (rs525496) is statistically associated with eQTL for several genes in different tissues (Supporting Information Table S8). We found eQTLs for four different genes in brain: (1) TMSB15B, (2) LL0XNC01–116E7.1, and (3) GLRA4 in cerebellum, and (4) H2BFM in brain—nucleus accumbens (basal ganglia). None of these four genes have been previously associated with PD. However, the colocalization analysis suggests that rs525496 may not mediate PD risk through expression of these genes. GLRA4 is a glycine receptor, with some studies showing that glycine may have neuroprotective properties.46,47 Furthermore, a deletion of the chromosomal region including GLRA4 was associated with craniofacial anomalies, intellectual disability, and behavioral problems.48 This variant is also associated with eQTL for RAB9B gene in cells (cultured fibroblasts), a nonbrain tissue. Several studies have shown a relationship between the Ras analog in brain genes (RAB) in the pathogenesis of PD.49,50 Although none of these studies directly mention RAB9B, they did investigate the role of RAB9A, a gene paralog of RAB9B. We also investigated eQTL gene expression and observed statistical differences in the RNA expression of the genes GLRA4, RAB9B, and H2BFM between cases and controls segregated by sex and ethnicity in the PPMI dataset.
We also performed a meta-analysis between Le Guen et al’s24 results, LARGE-PD cohorts, and IPDGC+Bambuí. No new variants reached the GWAS PVT, but two new regions reached GWAS suggestive P values in Females, and we lose one region in Males (Supporting Information Fig. S11).
In addition to the identification and validation of PD-associated regions on the X-chr, we observed a stark difference in the quality of imputation between the X-chr and autosomes. This is important because such differences may indicate the need for adaptations in current imputation methodologies. We also observed a low correlation between autosomal and X-PCA, suggesting the PCA of autosomal chromosomes should not be used to control for population structure in studies investigating associations in the sex chromosomes, at least in Latin American individuals. This low correlation may be because of the fact that recombination on the X-chr occurs only in females, so evolutionary forces exert a greater effect on this chromosome.
Along with the study by Le Guen and collaborators,24 we have highlighted the potential role of variants in the X-chr in PD etiology. Our study also emphasized the importance of analyzing diverse ancestral backgrounds. Many genetic factors are associated with ancestry, thus studies not including individuals of diverse ancestry may result in novel loci being overlooked. However, analysis of admixed populations requires complex quality and harmonization pipelines. We modified the harmonization pipeline of Le Guen and collaborators24 and implemented all steps to conduct an XWAS in admixed populations. All code is publicly available at https://github.com/MataLabCCF/XWAS/.
Our study has some limitations. The first is our sample size. We started our analysis with 1498 samples, a small number of samples for an association study. This problem was aggravated when considering that some analyses were performed segregating by sex and site, which further decreased our sample size. We tried to minimize this limitation using Firth’s regression. Another limitation is the imputation performance as previously mentioned. To avoid false-positives, we chose to use only variants with high imputation quality. Another limitation is the lack of Latin American replication cohorts, especially with Native American ancestry genetic background. The last limitation is that we used the X-chr PVT instead of using the Genome-Wide PVT (P < 5 × 10⁻⁸); thus, further replication of our results is needed.
In conclusion, our work provides evidence for new loci on the X-chr in an admixed population using a novel pipeline specific for a heterogeneous admixed population. Furthermore, we validated in a Latin American cohort one of the variants identified by Le Guen and collaborators.24 We identified new variants that are statistically associated with eQTL to several genes, including GLRA4, which has been previously associated with neurodegenerative diseases, although these findings require further investigation.
Supplementary Material
Acknowledgments:
This work was supported by the National Institutes of Health (NIH) grants (R01 1R01NS112499-01A1 to T.P.L and I. F.M.; T32 AG000262 to J.N.F.-K; Intramural Research Program (IRP), National Human Genome Research Institute (NHGRI) of the NIH to M. H.G.; IRP of the NIH, National Institute on Aging (NIA), ZO1 AG000535, and ZIA AG000949 to S.B.-C; T32HL007698 to D.P.L.; D43TW009345 to M.R.C.-O; R35HG010692 to T.D.O.), “The Committee for Development and Research” (Comité para el desarrollo y la investigación-CODI)-Universidad de Antioquia (Grant 2020-31455 to C.V.-P. and M.J.-D.-R), Fundação de Amparo à Pesquisa do Estado de Minas Gerais (grant RED 00314-16 to E.T.-S.), Brazilian Ministry of Health (Programa Nacional de Genômica e Saúde de Precisão – Genomas Brasil to E.T.-S.), Conselho Nacional de Desenvolvimento Científico e Tecnológico – CNPq (E.T.-S.), Parkinson’s Foundation (International Research Grants Program award to C.P.Z. and I.F.M.), Stanley Fahn Junior Faculty Award (I.F.M.), American Parkinson’s Disease Association (I.F.M.), Michael J. Fox Foundation (I.F.M.), ASAP-GP2 (I.F.M.), and with resources and the use of facilities at the Veterans Affairs Puget Sound Health Care System (C.P.Z. and I.F.M.). We are grateful to the DNA-Neurogenetics Bank of the Instituto Nacional de Ciencias Neurológicas (INCN - Peru) for supporting the collection of DNA samples and associated data used in this publication. We thank all of the individuals who participated in LARGE-PD. We also thank all the support staff at the different Latin American sites for their efforts and support building this incredible resource. We thank Cassandra Talerico, PhD, a salaried employee of the Cleveland Clinic, for assistance with manuscript review and editing. We thank Dr. Maira Tonidandel and Dr. Paulo Caramelli for their help with PD cases in the Bambuí cohort. We also thank members of the International Parkinson Disease Genomics Consortium (IPDGC) for their contributions of both data and expertise to this project. [Correction added on 28 July 2023, after first online publication: Acknowledgments are updated in this version.].
Funding Agencies:
This work was supported by the National Institutes of Health (NIH) grants (R01 1R01NS112499-01A1 to T.P.L and I.F.M.; T32 AG000262 to J.N.F.-K; Intramural Research Program (IRP), National Human Genome Research Institute (NHGRI) of the NIH to M.H.G.; IRP of the NIH, National Institute on Aging (NIA), ZO1 AG000535, and ZIA AG000949 to S.B.-C; T32HL007698 to D.P.L.; D43TW009345 to M.R.C.-O; R35HG010692 to T.D.O.), “The Committee for Development and Research” (Comité para el desarrollo y la investigación)-Universidad de Antioquia (Grant 2020-31455 to C.V.-P. and M.J.-D.-R.), Fundação de Amparo à Pesquisa do Estado de Minas Gerais (grant RED 00314-16 to E.T.-S.), Brazilian Ministry of Health (Programa Nacional de Genômica e Saúde de Precisão – Genomas Brasil to E.T.-S.), Conselho Nacional de Desenvolvimento Científico e Tecnológico–CNPq (E.T.-S.), Parkinson’s Foundation (International Research Grants Program award to C.P.Z. and I.F.M.), Stanley Fahn Junior Faculty Award (to I.F.M.), American Parkinson’s Disease Association (I.F.M.), The Michael J. Fox Foundation (I.F.M.), ASAP-GP2 (I.F.M.), and with resources and the use of facilities at the Veterans Affairs Puget Sound Health Care System (C.P.Z. and I.F.M.). International Parkinson Disease Genomics Consortium (IPDGC). [Correction added on 28 July 2023, after first online publication: Funding information is updated in this version.].
APPENDIX
Members of the Latin American Research Consortium on the Genetics of PD (LARGE-PD)
Argentina: Federico Micheli, Emilia Gatto, Clarisa Marchetti, Marcelo Kauffman, Alejandro Pellene, Marcela Montiel, Alejandro San Juan, Carolina Villa, Emmanuel Franchello
Brazil: Vitor Tumas, Delson José da Silva, Francisco Eduardo Costa Cardoso, Helio Afonso Ghizoni Teive, Artur Francisco Schumacher-Schuh, Carlos Roberto de Mello Rieder, Marcus Vinicius Della Coletta, Bruno Lopes dos Santos Lobato, Egberto Reis Barbosa, Pedro Renato de Paula Brandão, Clécio de Oliveira Godeiro Júnior, Vanderci Borges, Pedro Braga Neto, Ana Lucía Zuma de Rosso, Grace Helena Letro, Maria Gabriela dos Santos Ghilardi
Chile: Pedro Chana, Patricio Olguin
Colombia: Carlos Velez-Pardo, Gonzalo Arboleda Bustos, Ruth Eliana Pineda Mateus, Sonia Catalina Cerquera Cleves, Jorge Luis Orozco Velez
Costa Rica: Jaime Fornaguera
Dominican Republic: Rossy Cruz Vicioso
Ecuador: Edison Vasquez
El Salvador: Susana Peña
Grenada: Andrew Sobering
Honduras: Reyna Duron Martinez, Alex Medina
Mexico: Daniel Martinez Ramirez, Mayela Rodriguez, Renteria Miguel
Peru: Mario Cornejo-Olivas, Angel Medina, Julia Esther Rios Pinto, Ivan Fernando Cornejo Herrea, Edward Ochoa Valle, Nicanor Mori
Puerto Rico: Angel Viñuela
Uruguay: Elena Dieguez, Victor Raggio
[Correction added on 28 July 2023, after first online publication: The Appendix was added in this version.].
Footnotes
Relevant conflicts of interest/financial disclosures: All authors declare that they have no conflicts of interest.
Financial Disclosures
Full financial disclosures and author roles may be found in the online version of this article.
Supporting Data
Additional Supporting Information may be found in the online version of this article at the publisher’s web-site.
Data Availability Statement
Data available on request due to privacy/ethical restrictions.
References
- 1.Dorsey ER, Bloem BR. The Parkinson pandemic-A call to action. JAMA Neurol 2018;75:9–10. [DOI] [PubMed] [Google Scholar]
- 2.Tysnes O-B, Storstein A Epidemiology of Parkinson’s disease. J Neural Transm 2017;124:901–905. [DOI] [PubMed] [Google Scholar]
- 3.Zirra A, Rao SC, Bestwick J, Rajalingam R, Marras C, Blauwendraat C, et al. Gender differences in the prevalence of Parkinson’s disease. Mov Disord Clin Pract 2022;10:86–93. 10.1002/mdc3.13584 [DOI] [PMC free article] [PubMed] [Google Scholar]
- 4.Hägg S, Jylhävä J. Sex differences in biological aging with a focus on human studies. Elife 2021;10:e63425. 10.7554/eLife.63425 [DOI] [PMC free article] [PubMed] [Google Scholar]
- 5.Gur RE, Gur RC. Gender differences in aging: cognition, emotions, and neuroimaging studies. Dialogues Clin Neurosci 2002;4:197–210. [DOI] [PMC free article] [PubMed] [Google Scholar]
- 6.Marais GAB, Gaillard J-M, Vieira C, Plotton I, Sanlaville D, Gueyffier F, et al. Sex gap in aging and longevity: can sex chromosomes play a role? Biol Sex Differ 2018;9:33. [DOI] [PMC free article] [PubMed] [Google Scholar]
- 7.Subramanian I, Mathur S, Oosterbaan A, Flanagan R, Keener AM, Moro E. Unmet needs of women living with Parkinson’s disease: gaps and controversies. Mov Disord 2022;37:444–455. [DOI] [PubMed] [Google Scholar]
- 8.Gatto NM, Deapen D, Stoyanoff S, Pinder R, Narayan S, Bordelon Y, et al. Lifetime exposure to estrogens and Parkinson’s disease in California teachers. Parkinsonism Relat Disord 2014;20:1149–1156. [DOI] [PubMed] [Google Scholar]
- 9.Yoo JE, Shin DW, Jang W, Han K, Kim D, Won H-S, et al. Female reproductive factors and the risk of Parkinson’s disease: a nationwide cohort study. Eur J Epidemiol 2020;35:871–878. [DOI] [PubMed] [Google Scholar]
- 10.Kusters CDJ, Paul KC, Duarte Folle A, Keener AM, Bronstein JM, Bertram L, et al. Increased menopausal age reduces the risk of Parkinson’s disease: A mendelian randomization approach. Mov Disord 2021;36:2264–2272. [DOI] [PMC free article] [PubMed] [Google Scholar]
- 11.Simon KC, Chen H, Gao X, Schwarzschild MA, Ascherio A. Reproductive factors, exogenous estrogen use, and risk of Parkinson’s disease. Mov Disord 2009;24:1359–1365. [DOI] [PMC free article] [PubMed] [Google Scholar]
- 12.Lee YH, Cha J, Chung SJ, Yoo HS, Sohn YH, Ye BS, et al. Beneficial effect of estrogen on nigrostriatal dopaminergic neurons in drug-naïve postmenopausal Parkinson’s disease. Sci Rep 2019;9:10531. [DOI] [PMC free article] [PubMed] [Google Scholar]
- 13.Rugbjerg K, Christensen J, Tjønneland A, Olsen JH. Exposure to estrogen and women’s risk for Parkinson’s disease: a prospective cohort study in Denmark. Parkinsonism Relat Disord 2013;19:457–460. [DOI] [PubMed] [Google Scholar]
- 14.Lv M, Zhang Y, Chen G-C, Li G, Rui Y, Qin L, et al. Reproductive factors and risk of Parkinson’s disease in women: A meta-analysis of observational studies. Behav Brain Res 2017;335:103–110. [DOI] [PubMed] [Google Scholar]
- 15.Rao SC, Li Y, Lapin B, Pattipati S, Ghosh Galvelis K, Naito A, et al. Association of women-specific health factors in the severity of Parkinson’s disease. NPJ Parkinsons Dis 2023;9(1):86. 10.1038/s41531-023-00524-x [DOI] [PMC free article] [PubMed] [Google Scholar]
- 16.Bandres-Ciga S, Diez-Fairen M, Kim JJ, Singleton AB. Genetics of Parkinson’s disease: an introspection of its journey towards precision medicine. Neurobiol Dis 2020;137:104782. [DOI] [PMC free article] [PubMed] [Google Scholar]
- 17.Foo JN, Chew EGY, Chung SJ, Peng R, Blauwendraat C, Nalls MA, et al. Identification of risk loci for Parkinson disease in Asians and comparison of risk between Asians and Europeans: A genome-wide association study. JAMA Neurol 2020;77:746–754. [DOI] [PMC free article] [PubMed] [Google Scholar]
- 18.Schumacher-Schuh AF, Bieger A, Okunoye O, Mok K, Lim S-Y, Bardien S. et al. Underrepresented populations in parkinson’s genetics research: current landscape and future directions. Mov Disord 2022;37(8):1593–1604. 10.1002/mds.29126 [DOI] [PMC free article] [PubMed] [Google Scholar]
- 19.Loesch DP, Horimoto ARVR, Heilbron K, Sarihan EI, Inca-Martinez M, Mason E, et al. Characterizing the genetic architecture of Parkinson’s disease in Latinos. Ann Neurol 2021;90:353–365. [DOI] [PMC free article] [PubMed] [Google Scholar]
- 20.Loesch DP, Horimoto ARVR, Sarihan EI, Inca-Martinez M, Mason E, Cornejo-Olivas M, et al. Polygenic risk prediction and SNCA haplotype analysis in a Latino Parkinson’s disease cohort. Parkinsonism Relat Disord 2022;102:7–15. [DOI] [PMC free article] [PubMed] [Google Scholar]
- 21.Schurz H, Salie M, Tromp G, Hoal EG, Kinnear CJ, Möller M. The X chromosome and sex-specific effects in infectious disease susceptibility. Hum Genomics 2019;13:2. [DOI] [PMC free article] [PubMed] [Google Scholar]
- 22.Balaton BP, Dixon-McDougall T, Peeters SB, Brown CJ. The eXceptional nature of the X chromosome. Hum Mol Genet 2018;27:R242–R249. [DOI] [PMC free article] [PubMed] [Google Scholar]
- 23.Blauwendraat C, Iwaki H, Makarious MB, Bandres-Ciga S, Leonard HL, Grenn FP, et al. Investigation of autosomal genetic sex differences in Parkinson’s disease. Ann Neurol 2021;90:35–42. [DOI] [PMC free article] [PubMed] [Google Scholar]
- 24.Le Guen Y, Napolioni V, Belloy ME, Yu E, Krohn L, Ruskey JA, et al. Common X-chromosome variants are associated with Parkinson disease risk. Ann Neurol 2021;90:22–34. [DOI] [PMC free article] [PubMed] [Google Scholar]
- 25.Alexander DH, Novembre J, Lange K. Fast model-based estimation of ancestry in unrelated individuals. Genome Res 2009;19:1655–1664. [DOI] [PMC free article] [PubMed] [Google Scholar]
- 26.Lima-Costa MF, Firmo JOA, Uchoa E. Cohort profile: the Bambui (Brazil) cohort study of ageing. Int J Epidemiol 2011;40:862–867. [DOI] [PubMed] [Google Scholar]
- 27.International Parkinson Disease Genomics Consortium (IPDGC). Ten years of the international Parkinson disease genomics consortium: Progress and next steps. J Parkinsons Dis. 2020;10:19–30. [DOI] [PMC free article] [PubMed] [Google Scholar]
- 28.Kehdy FSG, Gouveia MH, Machado M, Magalhães WCS, Horimoto AR, Horta BL, et al. Origin and dynamics of admixture in Brazilians and its effect on the pattern of deleterious mutations. Proc Natl Acad Sci U S A 2015;112:8696–8701. [DOI] [PMC free article] [PubMed] [Google Scholar]
- 29.Byrska-Bishop M, Evani US, Zhao X, Basile AO, Abel HJ, Regier AA, et al. High-coverage whole-genome sequencing of the expanded 1000 genomes project cohort including 602 trios. Cell 2022;185:3426–3440.e19. [DOI] [PMC free article] [PubMed] [Google Scholar]
- 30.Barbosa MT, Caramelli P, Maia DP, Cunningham MCQ, Guerra HL, Lima-Costa MF, et al. Parkinsonism and Parkinson’s disease in the elderly: a community-based survey in Brazil (the Bambuí study). Mov Disord 2006;21:800–808. [DOI] [PubMed] [Google Scholar]
- 31.Purcell S, Neale B, Todd-Brown K, Thomas L, Ferreira MAR, Bender D, et al. PLINK: a tool set for whole-genome association and population-based linkage analyses. Am J Hum Genet 2007;81:559–575. [DOI] [PMC free article] [PubMed] [Google Scholar]
- 32.Franke L, de Kovel CGF, Aulchenko YS, Trynka G, Zhernakova A, Hunt KA, et al. Detection, imputation, and association analysis of small deletions and null alleles on oligonucleotide arrays. Am J Hum Genet 2008;82:1316–1333. [DOI] [PMC free article] [PubMed] [Google Scholar]
- 33.Manichaikul A, Mychaleckyj JC, Rich SS, Daly K, Sale M, Chen W-M. Robust relationship inference in genome-wide association studies. Bioinformatics 2010;26:2867–2873. [DOI] [PMC free article] [PubMed] [Google Scholar]
- 34.Leal TP, Furlan VC, Gouveia MH, Saraiva Duarte JM, Fonseca PA, Tou R, et al. NAToRA, a relatedness-pruning method to minimizethe loss of dataset size in genetic and omics analyses. Comput Struct Biotechnol J 2022;20:1821–1828. [DOI] [PMC free article] [PubMed] [Google Scholar]
- 35.Loh P-R, Danecek P, Palamara PF, Fuchsberger C, A Reshef Y, K Finucane H, et al. Reference-based phasing using the haplotype reference consortium panel. Nat Genet 2016;48:1443–1448. [DOI] [PMC free article] [PubMed] [Google Scholar]
- 36.Das S, Forer L, Schönherr S, Sidore C, Locke AE, Kwong A, et al. Next-generation genotype imputation service and methods. Nat Genet 2016;48:1284–1287. [DOI] [PMC free article] [PubMed] [Google Scholar]
- 37.Taliun D, Harris DN, Kessler MD, Carlson J, Szpiech ZA, Torres R, et al. Sequencing of 53,831 diverse genomes from the NHLBI TOPMed program. Nature 2021;590:290–299. [DOI] [PMC free article] [PubMed] [Google Scholar]
- 38.Gogarten SM, Sofer T, Chen H, Yu C, Brody JA, Thornton TA, et al. Genetic association testing using the GENESIS R/Bioconductor package. Bioinformatics 2019;35:5346–5348. 10.1093/bioinformatics/btz567 [DOI] [PMC free article] [PubMed] [Google Scholar]
- 39.Mägi R, Morris AP. GWAMA: software for genome-wide association meta-analysis. BMC Bioinformatics 2010;11:288. [DOI] [PMC free article] [PubMed] [Google Scholar]
- 40.Chang CC, Chow CC, Tellier LC, Vattikuti S, Purcell SM, Lee JJ. Second-generation PLINK: rising to the challenge of larger and richer datasets. GigaScience 2015;4:7. 10.1186/s13742-015-0047-8 [DOI] [PMC free article] [PubMed] [Google Scholar]
- 41.Lonsdale J, Thomas J, Salvatore M, Phillips R, Lo E, Shad S, et al. The genotype-tissue expression (GTEx) project. Nat Genet 2013;45:580–585. [DOI] [PMC free article] [PubMed] [Google Scholar]
- 42.Wallace C. A more accurate method for colocalisation analysis allowing for multiple causal variants. PLoS Genet 2021;17:e1009440. [DOI] [PMC free article] [PubMed] [Google Scholar]
- 43.Machiela MJ, Chanock SJ. LDlink: a web-based application for exploring population-specific haplotype structure and linking correlated alleles of possible functional variants: fig. 1. Bioinformatics 2015;31:3555–3557. 10.1093/bioinformatics/btv402 [DOI] [PMC free article] [PubMed] [Google Scholar]
- 44.Popejoy AB, Fullerton SM. Genomics is failing on diversity. Nature 2016;538:161–164. 10.1038/538161a [DOI] [PMC free article] [PubMed] [Google Scholar]
- 45.Sirugo G, Williams SM, Tishkoff SA. The missing diversity in human genetic studies. Cell 2019;177:1080. 10.1016/j.cell.2019.04.032 [DOI] [PubMed] [Google Scholar]
- 46.Ullah R, Jo MH, Riaz M, Alam SI, Saeed K, Ali W, et al. Glycine, the smallest amino acid, confers neuroprotection against D-galactose-induced neurodegeneration and memory impairment by regulating c-Jun N-terminal kinase in the mouse brain. J Neuroinflammation 2020;17:303. [DOI] [PMC free article] [PubMed] [Google Scholar]
- 47.Amin FU, Shah SA, Kim MO. Glycine inhibits ethanol-induced oxidative stress, neuroinflammation and apoptotic neurodegeneration in postnatal rat brain. Neurochem Int 2016;96:1–12. [DOI] [PubMed] [Google Scholar]
- 48.Labonne JDJ, Graves TD, Shen Y, Jones JR, Kong I-K, Layman LC, et al. A microdeletion at Xq22.2 implicates a glycine receptor GLRA4 involved in intellectual disability, behavioral problems and craniofacial anomalies. BMC Neurol 2016;16:132. [DOI] [PMC free article] [PubMed] [Google Scholar]
- 49.Gao Y, Wilson GR, Stephenson SEM, Bozaoglu K, Farrer MJ, Lockhart PJ. The emerging role of Rab GTPases in the pathogenesis of Parkinson’s disease. Mov Disord 2018;33:196–207. [DOI] [PubMed] [Google Scholar]
- 50.Bellucci A, Longhena F, Spillantini MG. The role of Rab proteins in Parkinson’s disease Synaptopathy. Biomedicine 2022;10:1941. 10.3390/biomedicines10081941 [DOI] [PMC free article] [PubMed] [Google Scholar]
Associated Data
This section collects any data citations, data availability statements, or supplementary materials included in this article.
Supplementary Materials
Data Availability Statement
Data available on request due to privacy/ethical restrictions.