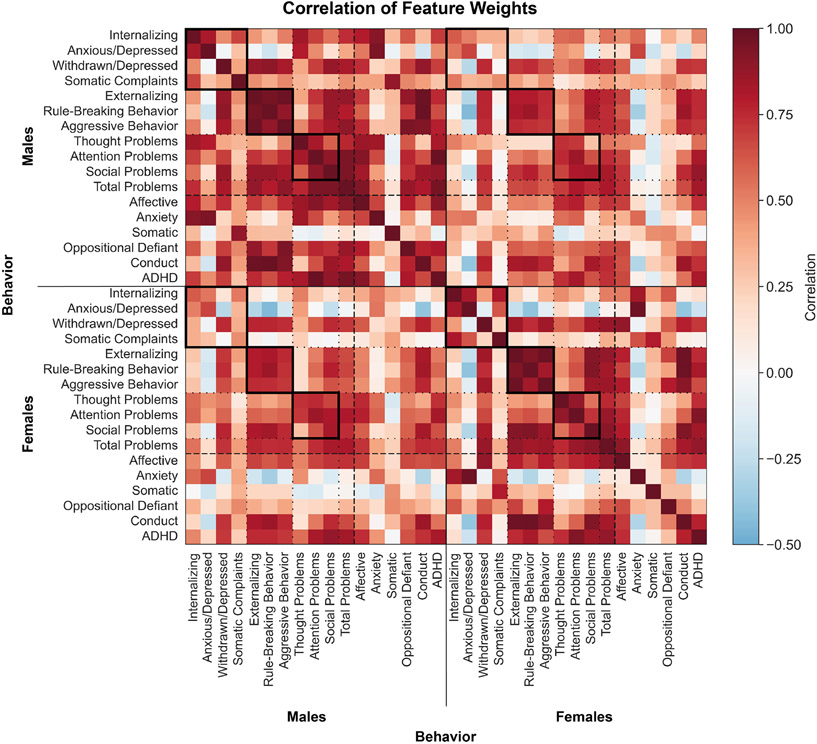
Figure 3: Shared functional connectivity features underlie distinct behaviors across the sexes.
Correlation coefficient between Haufe-transformed pairwise regional feature weights from distinct models. Models trained in males are shown at the top and on the left, models trained in females are shown at the bottom and on the right. Warmer colors indicate a positive correlation and cooler colors indicate a negative correlation. Solid black boxes highlight correlations between feature weights within behavioral domains within and between sexes.

