

Abstract
The present study examines the association between grey matter volume and cognition. Studies that have examined this issue have focused primarily on older adults, whereas the present study examines the issue across the entire adult lifespan. A total of 463 adults, ages 20–88 at first assessment, were followed longitudinally across three assessments over 8–10 years. Significant individual differences in a general cognition measure comprised of measures of speed of processing, working memory, and episodic memory were observed, as well as in measures of cortical and subcortical grey matter. Parallel process latent growth curve modeling showed a reliable relationship between decreases in cortical matter and cognitive decline across the entire adult lifespan, which persisted after controlling for age effects. Implications of these findings in relation to progression towards dementia, risk assessment, cognitive intervention, and environmental factors are discussed, as well as implications for theories of cognitive aging.
Keywords: Health Aging, Cognitive Decline, Longitudinal Change, Memory, Structural Equation Modeling (SEM), Parallel Process Linear Growth Curve Modeling (PLGC), MRI, Dallas Lifespan Brain Study (DLBS), Lifespan Cognitive Change
1. Introduction
Cognitive decline in later life is an established fact of human aging, with a broad array of cognitive processes affected, including episodic memory, speed of processing, working memory, and reasoning (Park et al., 2002; Salthouse, 2016; Verhaeghen & Salthouse, 1997). Accompanying this decline is structural deterioration of the brain that includes shrinkage of cortical and subcortical grey matter (Raz et al., 2003, 2005; 2010), as well as cortical thinning (Fjell et al., 2014; Rast et al., 2018, and see Kennedy & Raz, 2015 for a review). Many studies have suggested directly or indirectly that the loss of grey matter appears to be an important mechanism underlying the decline of cognitive function in later life (Cox et al., 2019, 2021; Head et al., 2008, Nickl-Jockshat et al., 2012; Park & Reuter-Lorenz, 2009, Reuter-Lorenz & Park; 2014), and this coupling of changes in grey matter with changes in cognition (i.e. change-change association) has been supported by several longitudinal studies assessing change-change associations in brain structure and cognitive performance. For example, Fletcher et al. (2018) found via latent variable modeling that change over 2 years in general cognition was strongly associated with longitudinal change in whole-brain grey matter volume in a cohort of 454 older adults. Hunt et al. (2021) found that change in cortical thickness mediated the association between a measure of socioeconomic status and change in a range of cognitive assessments in a sample of 601 older adults. Similarly, Vonk et al., (2022) identified a strong relationship between global brain atrophy (grey and white matter) and longitudinal decline in general cognitive ability in a sample of 989 middle-aged and older adults, although notably this association was stronger in later life.
As the above-summarized studies demonstrate, global measures of brain atrophy are strongly related to measures of general cognition in older adults. However, while this relationship is most pronounced – and more consequential – in later life, volumetric grey matter loss and cognitive decline are expressed to a lesser degree in middle- and even early adulthood (Bethlehem et al., 2022; Fjell et al., 2021; Salthouse, 2016; Walhovd et al., 2016). Studies of older adults have consistently reported age differences in the association between grey matter volume and cognitive performance at baseline assessment (Fletcher et al., 2018; Head et al., 2008; Hunt et al., 2021; Nickl-Jockshat et al., 2012; Raz et al., 2008; Vonk et al., 2022). To fully understand human development of brain and cognition, it is necessary to also study how loss of cortical volume influences cognitive trajectories in middle - and potentially early – adulthood. The present study examines the association of grey matter with cognition across the entire adult lifespan, as the extant data on this important issue is surprisingly limited.
There are a few studies that have examined this relationship in middle age and younger adults. Vonk et al. (2022), as discussed above, identified a weaker but still observable coupling between rates of whole brain atrophy and changes in cognitive function in adults aged 40 to 59, compared to older adults of age 60 and greater, demonstrating that indeed individual rates of brain atrophy and cognitive decline are related to one another beginning in middle age at the latest. As for findings pertaining to early adulthood, Lagnes et al. (2020)’s examination of the relationship between anterior and posterior hippocampal volume and episodic memory performance identified a similar pattern – change in hippocampal volume was reliably related to change in memory performance in their sample ranging from 4 to 91 years of age, although with a stronger relationship later in life. Persson et al. (2016), similarly identified a coupling of individual rates of change in prefrontal white matter and change in fluid intelligence in an adult lifespan sample (19–79 years of age). In aggregate these studies demonstrate that the general principle of a relationship between brain atrophy and cognitive decline occurs at midlife, and, at least in the case of the two specific relationships described by Lagnes et al., (2020) and Persson et al., (2016), early adulthood as well.
The present study aimed to further our understanding of how cognitive and brain structural change interrelate across the adult lifespan using the Dallas Lifespan Brain Study (DLBS) which followed 463 adults aged 20–88 for 8–10 years across three sampling waves and assessed both measures of brain structure and a wide array of cognitive measures. To assess the potential influence of grey matter atrophy on cognitive decline, the present study examined longitudinal changes in grey matter volume using used parallel process latent growth curve modeling (PLGC, Duncan, Duncan, & Stryker, 2013). This technique allows for the assessment of covariance changes (captured as longitudinal slopes of change over time) in grey matter volume (computed as a latent variable from lobular volumes) with parallel changes in cognition (derived from latent measures of speed of processing, working memory, and episodic memory). We elected to take a general approach to these issues similar to other recent studies (Rast et al., 2017; Cox et al., 2019, 2021; Fletcher et al., 2018) by examining the effect of latent grey matter volume on a latent general measure of cognition.
In the current study, this modeling approach was used to (a) determine whether there are individual differences in decline in cognition and grey matter volume, (b) incorporate individual differences in change for each variable in our models, and (c) ultimately determine whether the grey matter volume and cognition measures follow similar trajectories of change over time. In other words, we were interested in how tightly bound grey matter volume change is to cognitive change within individuals. We hypothesized that these two factors will be significantly coupled at the individual level not just in later life, but throughout the adult lifespan.
A second goal of the current study was to assess if observed rates of change in cognition and grey matter volume differ in magnitude at different points in the adult lifespan. Evidence from longitudinal assessments indicates that, in healthy individuals, loss of cortical grey matter is a continuous processes expressed throughout the lifespan (Bethlehem et al., 2022; Fjell et al., 2014), with accelerated decline observed in select cortical and subcortical regions (see Kennedy & Raz 2015 for a review). Similarly, there is ample evidence that general cognitive ability decreases throughout the adult lifespan, with accelerated decline with later age (Salthouse, 2016; and see Verhaeghen & Salthouse, 1997 for a meta-analytic review). We hypothesized that we would indeed observe an acceleration of decline in both factors over time, and that the change-change relationship between these two factors will be detectable and significant across the entire adult lifespan, although relatively weakest in early adulthood.
2. Method
2.1. Participants
An adult lifespan sample of 463 adults was recruited for the DLBS. Participants were invited to complete three assessments over approximately eight to ten years, and all participants completed at least one and a maximum of three occasions. Assessment 1 was completed in the first two years of the study and Assessment 2 occurred approximately four years later (Mtime = 3.9 years, SDtime = .39 years) with a range of 2.47 to 5.8 years. Assessment 3 took place about eight years (Mtime = 8.85 years, SDtime = 1.04 years) after Assessment 1 with a range of 6.11 to 10.65 years. Participant age at first assessment ranged from 21 to 88 years (Mage = 55.83 years, SDage = 16.87 years) with at least 40 participants at each decade. A total of 308 participants (66.5% of the initial sample) completed a second assessment, and 175 of those participants (37.8% of the initial sample) went on to complete the third assessment as well. Sex representation at Assessment 1 was 62% female, 38% male. All participants had an MMSE score greater than or equal to 26 at the first assessment, were recruited locally from the community, and were right-handed with normal or corrected to normal vision. Participants were screened (via self-report) for neurological and psychiatric disorders, loss of consciousness for more than ten minutes, a history of drug or alcohol abuse, and a history of major heart surgery or chemotherapy within five years. Participants’ characteristics are summarized in Table 1. All participants completed both a cognitive battery and an MRI scan at each assessment. This study was approved by and conducted in accordance with the University of Texas at Dallas and the University of Texas Southwestern Medical School institutional review boards. All participants provided written informed consent.
Table 1.
Summary of Demographic Characteristics and Volumetric Measures for the Sample, Grouped by Total Number of Assessments Completed.
| All Participants | Single Assessment Only | Two Total Assessments | Three Total Assessments | F | p | |
|---|---|---|---|---|---|---|
|
| ||||||
| N | 463 | 155 | 133 | 175 | - | - |
| Age | 58.24 (18.12) | 60.45 (19.4) | 59.09 (18.13) | 55.65 (16.68) | 3.12 | .045 |
| Female % | 62% | 57% | 66% | 63% | 1.46 | .233 |
| Education (years) | 15.75 (2.41) | 15.35 (2.62) | 15.65 (2.45) | 16.18 (2.1) | 5.07 | .007 |
| MMSE | 28.33 (1.8) | 28.07 (2.6) | 28.29 (1.3) | 28.58 (1.15) | 3.37 | .035 |
| Years in Study | - | - | 4.83 (2.45) | 8.51 (1.82) | - | - |
| Frontal GMV | 178×103 (25×103) | 174×103 (25×103) | 177×103 (26×103) | 183×103 (23×103) | 5.05 | .007 |
| Parietal GMV | 119×103 (16×103) | 117×103 (17×103) | 119×103 (17×103) | 122×103 (14×103) | 4.14 | .017 |
| Temporal GMV | 99×103 (13×103) | 96×103 (14×103) | 98×103 (14×103) | 101×103 (12×103) | 5.42 | .005 |
| Occipital GMV | 42×103 (6×10³) | 41×103 (6×10³) | 42×103 (7×10³) | 43×103 (6×10³) | 4.49 | .012 |
| Subcort. GMV | 56×103 (7×10³) | 51×103 (7×10³) | 56×103 (6×10³) | 57×103 (6×10³) | 2.75 | .065 |
| DComp | .06 (.96) | −.08 (1.01) | −.01 (1.1) | .25 (.83) | 5.28 | .005 |
| DSST | .1 (.97) | −.09 (.97) | 0 (1.03) | .36 (.87) | 10.12 | <.001 |
| SWM | −.05 (1) | −.15 (1.02) | .22 (1.02) | .15 (.93) | 6.12 | .02 |
| LNS | 0 (.99) | −.19 (.88) | −.15 (.99) | .28 (1.03) | 11.92 | <.001 |
| VRM | 0 (.93) | −.19 (.91) | −.12 (.87) | .26 (.95) | 11.12 | <.001 |
| HVLT | .02 (.97) | −.16 (.96) | −.08 (.94) | .25 (.98) | 8.66 | <.001 |
Note. Columns summarize participant groups based on total number of assessments completed. All measures are as recorded at assessment one. Age is presented in years. Cortical and subcortical grey matter volumes (GMV), are presented in cubic millimeters (mm3). Cognitive assessments (including DComp/digit comparison test, DSST/digit symbol substitution test, SWM/spatial working memory test, LNS/letter-number sequencing test and HVLT/Hopkins verbal learning test) are presented in z-score units. Standard deviations are in parentheses. MMSE = Mini-Mental State Exam.
2.2. Cognitive Measures
Cognition was examined using six tasks that served as indicators of three cognitive constructs: speed of processing, working memory, and episodic memory. The tasks are described below.
Speed of Processing.
Digit Comparison Task (DComp).
(Hedden et al., 2002; adapted from Salthouse & Babcook 1991). Participants were asked to compare strings of simultaneously presented digits (span varying between 3 and 9) and identify if each was identical or different. The outcome measure was the number of correct comparisons performed in 45 seconds.
Digit-Symbol Substitution (DSST).
This is a subtask from the 3rd revision of the Weschler Adult Intelligence Scale (WAIS-III; Weschler, 1997). Participants were asked to translate a string of digits into a series of non-familiar symbols using a substitution cypher, with the outcome measure being the number of digits translated correctly within 90 seconds.
Working Memory.
Spatial Working Memory (SWM).
This task is a subtask of the Cambridge Neuropsychological Test Automated Battery (CANTAB; Robbins et al. 1994). Participants are given an abstract figure that is a probe item (“blue token”) and are asked to search a number of simultaneously presented boxes (spanning 4–8) to locate and then move the token to a final depository. Then a new token is hidden, and this routine continues until a token has been discovered in all boxes. Within a given trial, participants must maintain which boxes they have already searched in working memory in order to avoid erroneously revisiting a box that they have already searched as each box never has a token twice. The outcome measure of this task is the inverse-coded number of search errors performed throughout all trials.
Letter-Number Sequencing (LNS).
This is a subtask of the WAIS-III battery (Weschler, 1997). Participants are presented with mixed strings of verbally presented letters and numbers in random order that range from two to eight in length. They are required to reorganize the string of items by providing an oral listing of the string, with the numbers in ascending order followed by letters in alphabetical order. The length of the string is incremented by one for each of three correct responses given. The outcome measure of this task is the total number of correct responses given before failure, or before the maximum number of trials (24) is reached.
Episodic Memory.
Immediate and Delayed Memory (HVLT):
Hopkins Verbal Learning Test (Brandt, 1991). In the Immediate Recognition Task (IRT), participants were verbally presented with a list of 12 words sequentially, which they are required to recall immediately after exposure. The outcome measure of this task is the number of words remembered correctly. The Delayed Recognition Task (DRT) is administered 40 minutes later and ask participants to identify which 12 of 24 verbally and sequentially-presented words they were previously exposed to in the IRT. The outcome measure of the DRT is the number of words out of 12 that the participant correctly identified as having been previously seen. The outcome of the IRT and DRT were summed to create a single measure of memory performance (HVLT).
Verbal Recognition Memory (VRM):
CANTAB (Robbins et al., 1994). The Immediate Recognition task is a similar recognition task to the one utilized in the HVLT, though using a different set of stimuli presented visually. Participants are exposed to a series of 12 printed words presented sequentially. Participants are then shown a sequential list of 24 printed words, of which 12 were included in the immediately preceding wordlist. Performance in this task is the number of out of 12 that the participant correctly identifies as belonging to the immediately preceding wordlist.
2.3. Grey Matter Measures
Both cortical and subcortical grey matter volume were collected using the procedures described below.
2.3.1. MRI Acquisition.
Participants were scanned using a 3T Philips Achieva scanner with an 8-channel head coil at all three timepoints. At the third assessment, 50 participants were scanned on a newer 3T Philips Achieva scanner, which was installed in 2011, using an 8-channel head coil and identical scanning parameters. High-resolution anatomical images were collected with a T1-weighted magnetization-prepared rapid gradient-echo sequence (MP-RAGE) with 160 sagittal slices, field of view (FOV) = 204 × 256 × 160 mm; voxel size: 1 × 1 × 1 mm3; time to repetition: 8.1 ms; echo time: 3.7 ms; flip-angle: 12°.
2.3.2. Brain Volume Estimates.
Cortical reconstruction and volumetric segmentation of the MP-RAGE images taken at all three timepoints was conducted with the FreeSurfer 5.3 image analysis suite (Desikan et al., 2006; http://surfer.nmr.mgh.harvard.edu/), using procedures described in prior publications by others (Dale, Fischl, & Serena, 1999; Dale & Sereno, 1993; Fischl & Dale, 2000; Fischl et al., 2002; Fischl, Salat, et al., 2004; Fischl, Sereno, & Dale, 1999; Fischl, Sereno, Tootell, & Dale, 1999; Fischl, Van Der Kouwe, et al., 2004b; Han et al., 2006; Jovicich et al., 2006; Ségonne et al., 2004). Manual dura removal and control point edits for the parcellation derived from the FreeSurfer-standard regional labels were performed by a trained research team and independently assessed by an expert, as described in a prior publication (Savalia et al., 2017). Bilateral lobular volume estimates were calculated by summing the cortical parcellation constituting each of the frontal (caudal anterior cingulate, caudal middle frontal, frontal pole, medial orbitofrontal, paracentral lobule, pars opercularis, pars orbitalis, pars triangularis, posterior cingulate, precentral gyrus, rostral anterior cingulate, rostral middle frontal gyrus and superior frontal parcellations), parietal (postcentral gyrus, precuneus, superior parietal lobule, supramarginal gyrus, and isthmus parcellations), occipital (cuneus, lateral occipital lobe, lingual gyrus and pericalcarine parcellations) and temporal (banks of the superior temporal sulcus, entorhinal cortex, fusiform gyrus, inferior temporal gyrus, middle temporal gyrus, parahippocampal gyrus, superior temporal gyrus, temporal pole, transverse temporal) lobes. Considering FreeSurfer’s documented difficulty in consistently segmenting subcortical regions (Mulder et al., 2014; Srinivasan et al., 2020), we elected to utilize the estimate of total bilateral subcortical grey matter volume produced by the segmentation process rather than examine specific subcortical volumes. The resulting lobular cortical, and subcortical grey matter volume estimates were used in subsequent analyses.
2.4. Analysis Plan
2.4.1. Principal Component Analysis of Cognitive Measures.
The cognitive data from all subjects at Assessment 1 were cast into a principal component analysis (PCA) to assess the accurate assignment of our a priori constructs (Speed of Processing, Working Memory, and Episodic Memory). The results of this PCA informed our modeling of latent cognition within the univariate and parallel process latent growth curve models defined in section 2.4.3. This analysis was conducted using the InPosition package (Beaton et al., 2014) in R 4.2.2 (R Core Team, 2021). See Supplemental section S.1 for further details.
2.4.2. Missingness Analysis.
Due to the attrition exhibited over the three assessments of the DLBS, we ran a series of linear mixed effect models relating our independent and dependent variables of interest (DComp, DSST, SWM, LNS, VRM, HVLT, Cortical GMV, Subcortical GMV) as well as pertinent control variables (Age, Sex, Education, MMSE) to the number of assessments completed by each participant. The full specifications of this analysis can be found in supplementary section S.1
2.4.3. Latent Growth Curve Modeling
A latent-growth curve structural equation modeling approach (Duncan, Duncan, & Strycker, 2013) was utilized to analyze these data. All analyses were implemented in the lavaan library (Rossel, 2012) in R 4.2.2 (R Core Team, 2021), with full information maximum likelihood estimation (FIML) implemented under missing-at-random assumptions to use all available data for each participant. Goodness of fit of all models was assessed via comparative fit index (CFI), root-mean-square error of approximation (RMSEA), and standardized root-mean-square residual (SRMR). As recommended by Hu and Bentler (1999) good model fit is indicated by RMSEA <= .06. SRMR <= .08, and CFI >=.95, with acceptable fit indicated by RMSEA <= .08 and CFI >= .9.
2.4.3.1. Latent Univariate Growth Curve models.
We first developed independent univariate growth models to identify the individual developmental trajectories of the cognitive and grey matter variables over time. These time-based models had three occasions of measurement and scaled linear change across these three time points (e.g., McArdle & Nesselroade, 2014). We also specified residual covariances over time for each variable, capturing specific sources of stable variance for each variable (Hertzog & Nesselroade, 2003). We fit both a no-growth model for each variable as well as a linear growth curve model that focused on intra-participant change across time. Three growth models were fit, one each for cortical grey matter volume, subcortical grey matter volume, and cognition. Based on the results of our principal component analysis (described in section 2.4.1 and supplemental section S.1, results reported in section 3.1 below) we calculated a single latent growth curve reflecting latent general cognitive ability (GenCog) from all administered cognitive measures. Similarly, we calculated a single latent growth curve reflecting latent cortical grey matter volume (CGMV) from the lobular volume estimates assessed at each time point. The growth curve fit to latent subcortical grey matter volume (SCGMV) was calculated from the single subcortical grey matter volume estimate assessed at each time point. Data from all participants were included, with missing data accounted for using R’s FIML estimation procedures to account for missing data. For latent variables with multiple indicators (e.g., GenCog), the regressions of variables on factors (e.g., Episodic Memory on GenCog) were constrained to be equal across the three waves of measurement (model comparisons not reported here showed that imposing invariance in factor loadings over time had no impact on model fit, justifying the assumption of longitudinal factor invariance).
2.4.3.2. Hypothesis testing using parallel-process latent growth curve models.
To assess inter-relations between change-over-time in cortical and subcortical grey matter volume and general cognitive performance, we combined the univariate growth models described above into a single parallel-process latent growth curve model, as visualized in Figure 1. In this model, the latent slope and intercept values of each of our three variables of interest (GenCog, CGMV, SCGMV) were allowed to freely covary. All other model constraints are consistent with those applied in the univariate models described above. Figure 1 presents the measurement model for the analysis. Section A (at the top of the model), presents the measures used to create a latent construct for cortical grey matter volume (CGMV) at each of the three assessments. These indicators of CGMV are comprised of the lobe volume for frontal, parietal, temporal, and occipital lobes based on FreeSurfer estimates. Section B, on the right side of the model, pertains to subcortical grey matter volume (SCGMV). Due to the limited scope of our subcortical grey matter volume measure, we further simplified the univariate growth model applied to the subcortical volumetric data to ensure identification of the model. Specifically, residual covariances between assessments of cortical/subcortical GMV were set to 0, and residual variances of each assessment were constrained to equal one-another. Sections C and D at the bottom of the figure reflect the latent growth curve describing general cognition, with Section C describing the slope and intercept fit to latent cognition at each assessment, and Section D indicating the individual cognitive measure which were used to estimate latent cognition at each assessment. We note that repeated measures of a given cognitive variable were allowed to freely covary, to account for repeated measures effects. Additionally, the loadings of each measured variable onto the superseding latent variable were equated across time points.
Figure 1. Measurement Diagram for Parallel Latent Growth Curve Model.
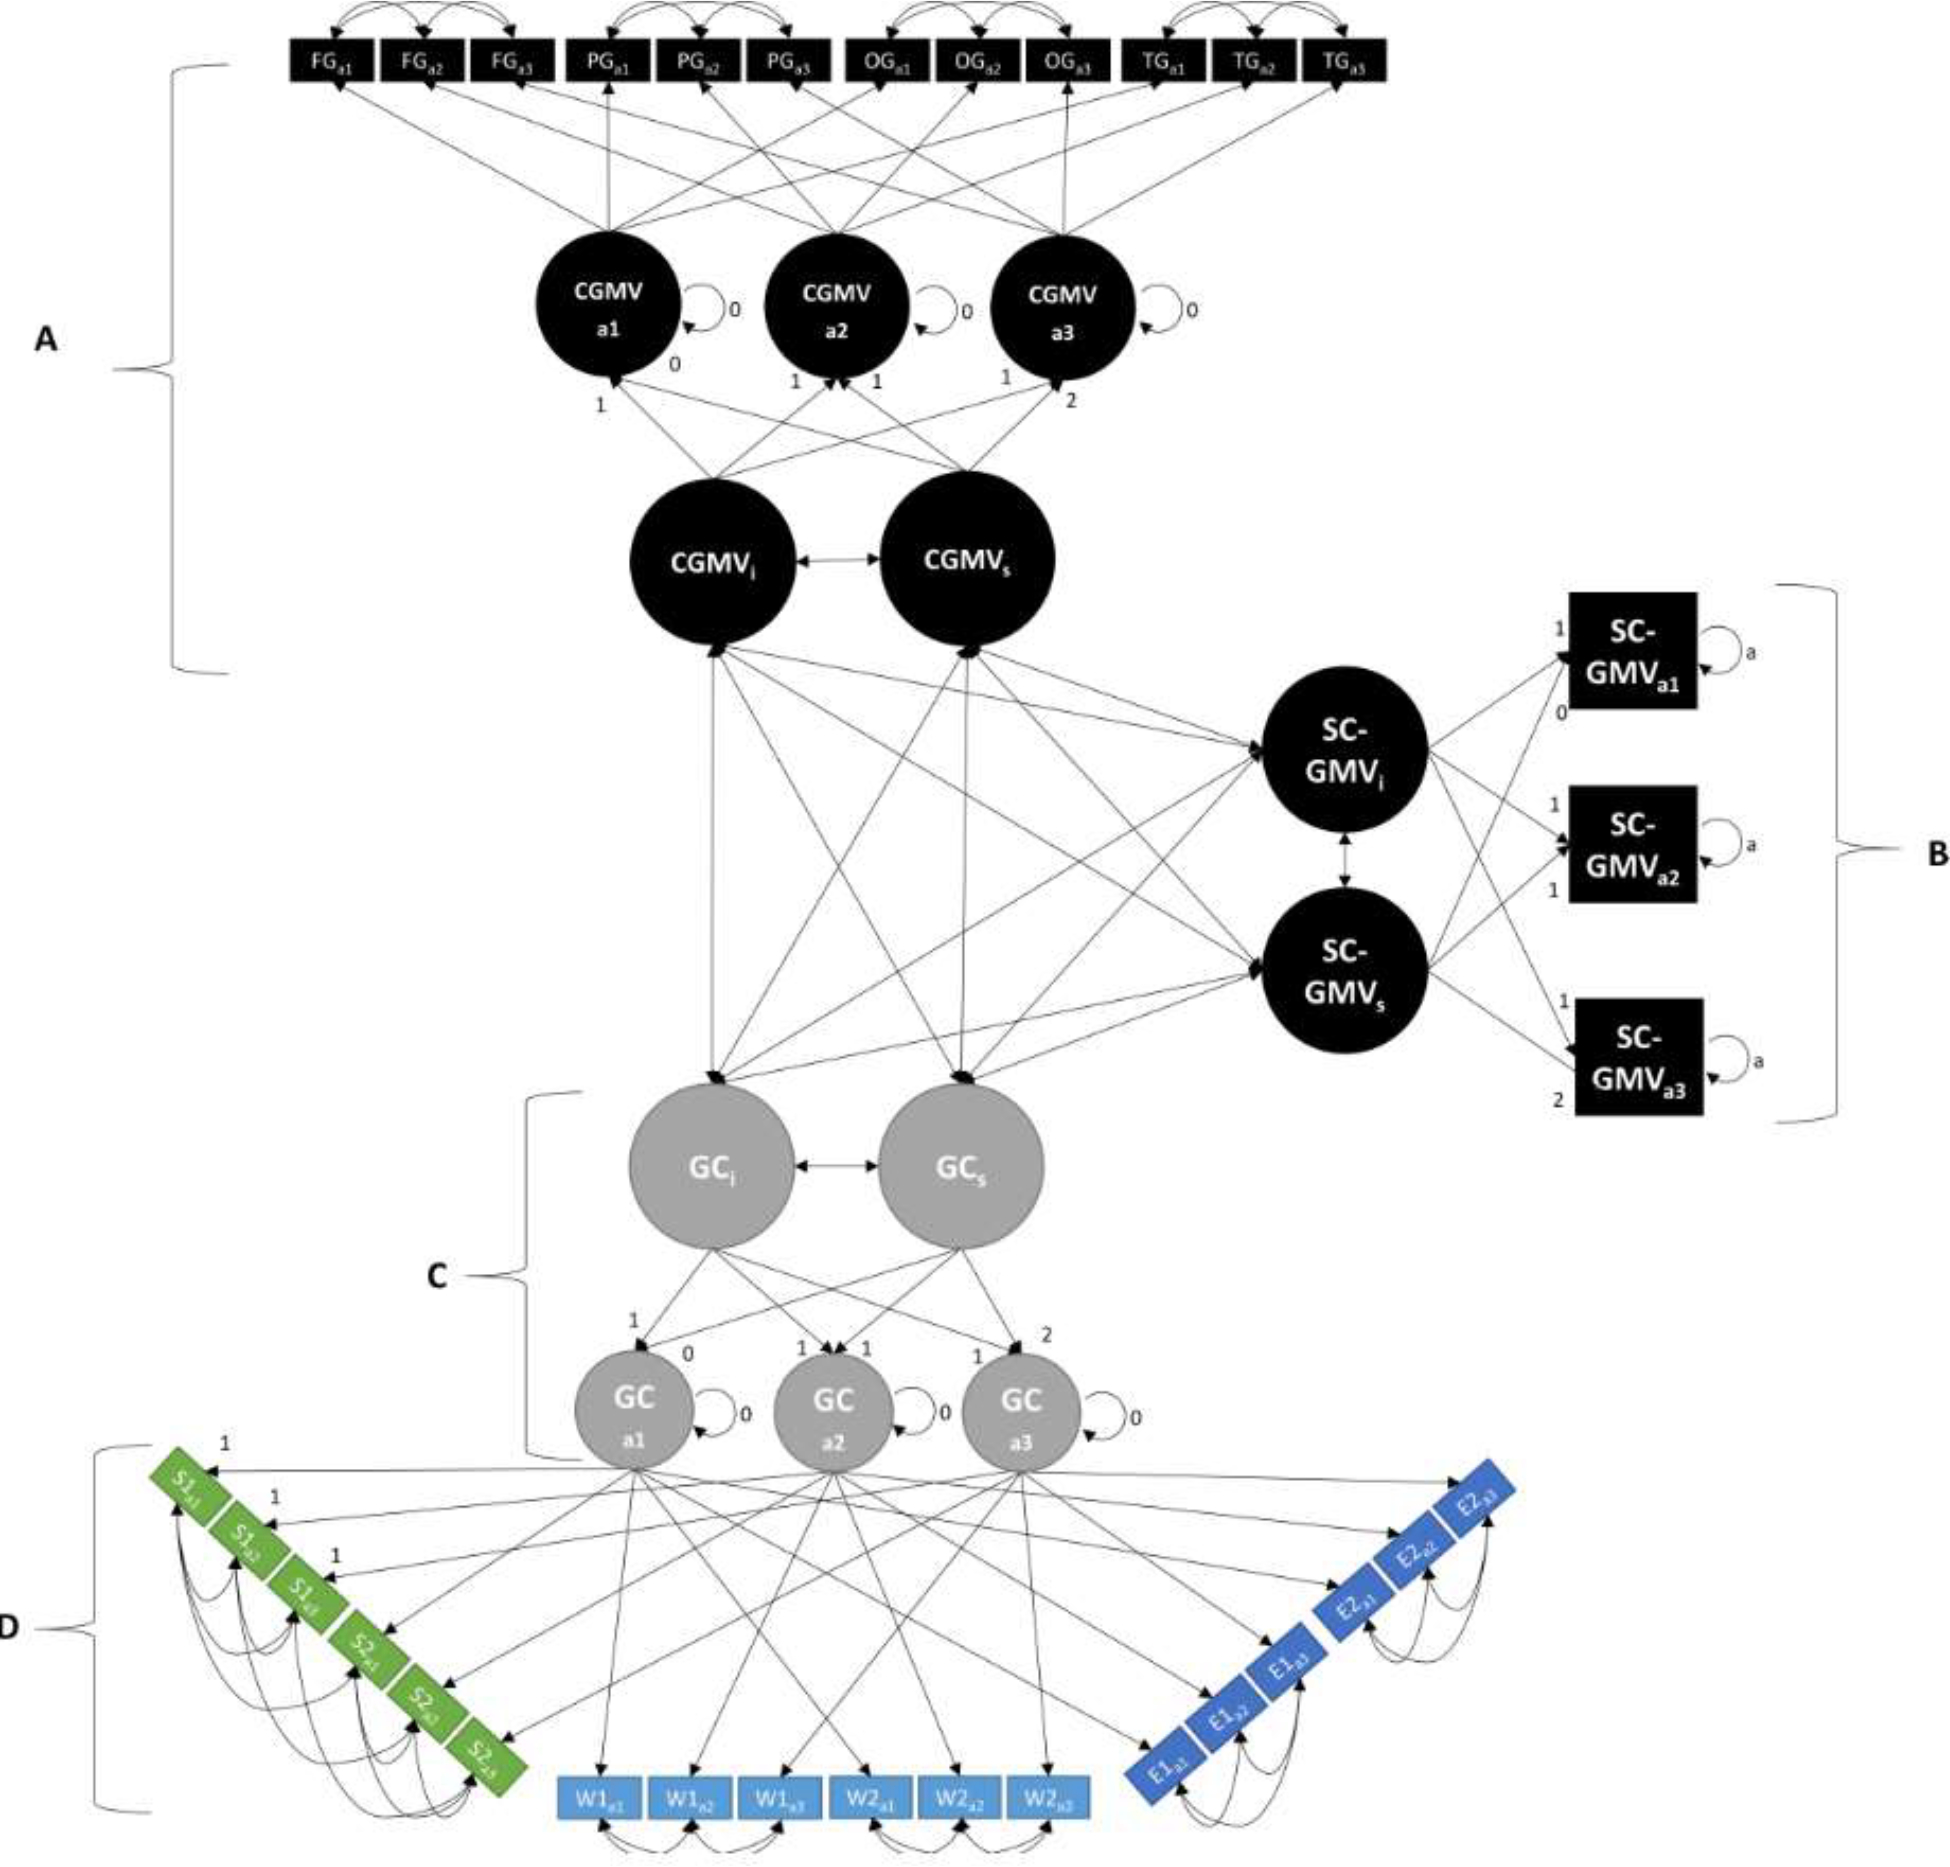
Sections A, B, C, and D, represent cortical grey matter (CGMV), subcortical grey matter (SCGMV), general cognition (GenCog/GC), and individual cognitive tasks, respectively. Subscripts a1-a3 refer to measures taken at assessment 1, 2, or 3, respectively. Subscripts s and i refer to latent slopes and intercepts, respectively. FG = Frontal Grey Matter Volume/FGMV; PG = Parietal Grey Matter Volume/PGMV; OG = Occipital Grey Matter Volume/OGMV; TG = Temporal Grey Matter Volume/TGMV; GC = General Cognition/GenCog; S1 = Digit Comparison; S2 = DSST; W1 = Letter-Number Sequencing; W2 = Spatial Working memory; E1 = Verbal Recall Memory; E2 = Hopkins Memory/HVLT.
2.4.3.3. Assessing age effects via conditional models.
Thus far, we have not tested the effects of age on our model. To do this, we developed a conditional version of the model displayed in Figure 1 above that allowed us to determine if observed relationships differed as a function of age. This conditional model included regression terms for the direct effect of (baseline) age, as well as linear (age*time) and quadratic (age2*time) interaction terms applied to the latent cognition and structural variables, and is otherwise identical to the model presented in Figure 1.
3. Results
3.1. Principal Component Analysis of Cognitive Measures.
To check whether our specification of a single general cognition variable at each time point was accurate, we conducted a PCA on our time-1 cognitive data which identified a single significant (p = .001) component that explained 52.8% of the variance in cognitive measures at the first assessment (see supplementary section S.1). The first component was comprised of all six of the cognitive measures administered (see section 2.2) with each contributing strongly and unidirectionally to the first component. Considering this strong general component, we elected to fit all six cognitive measures to a single latent general cognition component in our growth models, as described above in section 2.4.3.
3.2. Missingness Analysis.
The full specifications and results of this analysis are reported in the supplementary material, section S2. To summarize, we found significant effects of age, β = .19, t(454) = 3.08, p = .002, cortical GMV, β = .22, t(454) = 3.27, p = .001, LNS, β = .1, t(454) = 2.17, p = .031, and VRM, β = .1, t(454) = 2.18, p = .03, on number of assessments completed after controlling for all other variables of interest. Importantly, all identified variables were positively related to number of assessments completed, meaning participants who were older, with greater cortical grey matter volume, and greater performance on the letter-number sequencing and verbal recall memory measures were more likely to return for repeat assessments. These findings support the inclusion of participants that attrited during data collection, due to a systematic difference observed between the one-, two-, and three-session cohorts on several variables of interest. Summary statistics for each cohort can be found in Table 1.
3.3. Preliminary descriptive statistics.
As can be observed in Figure 2, panel A, at the first assessment, all cognitive measures demonstrated the expected pattern of differences between age groups, closely mirroring earlier cross-sectional studies of cognitive aging (e.g., Park et al., 2002). However, we note that in Figure 2A there is considerable separation of measures among the 20- to 29-year-old participants which systematically decreases with age. Grey matter volume shows a similar pattern of decline across age groups at the first assessment, as depicted in Figure 2, panel B, though this pattern is less pronounced.
Figure 2. Cognitive and Structural Measures by Decade of Life, as Measured at First Assessment.
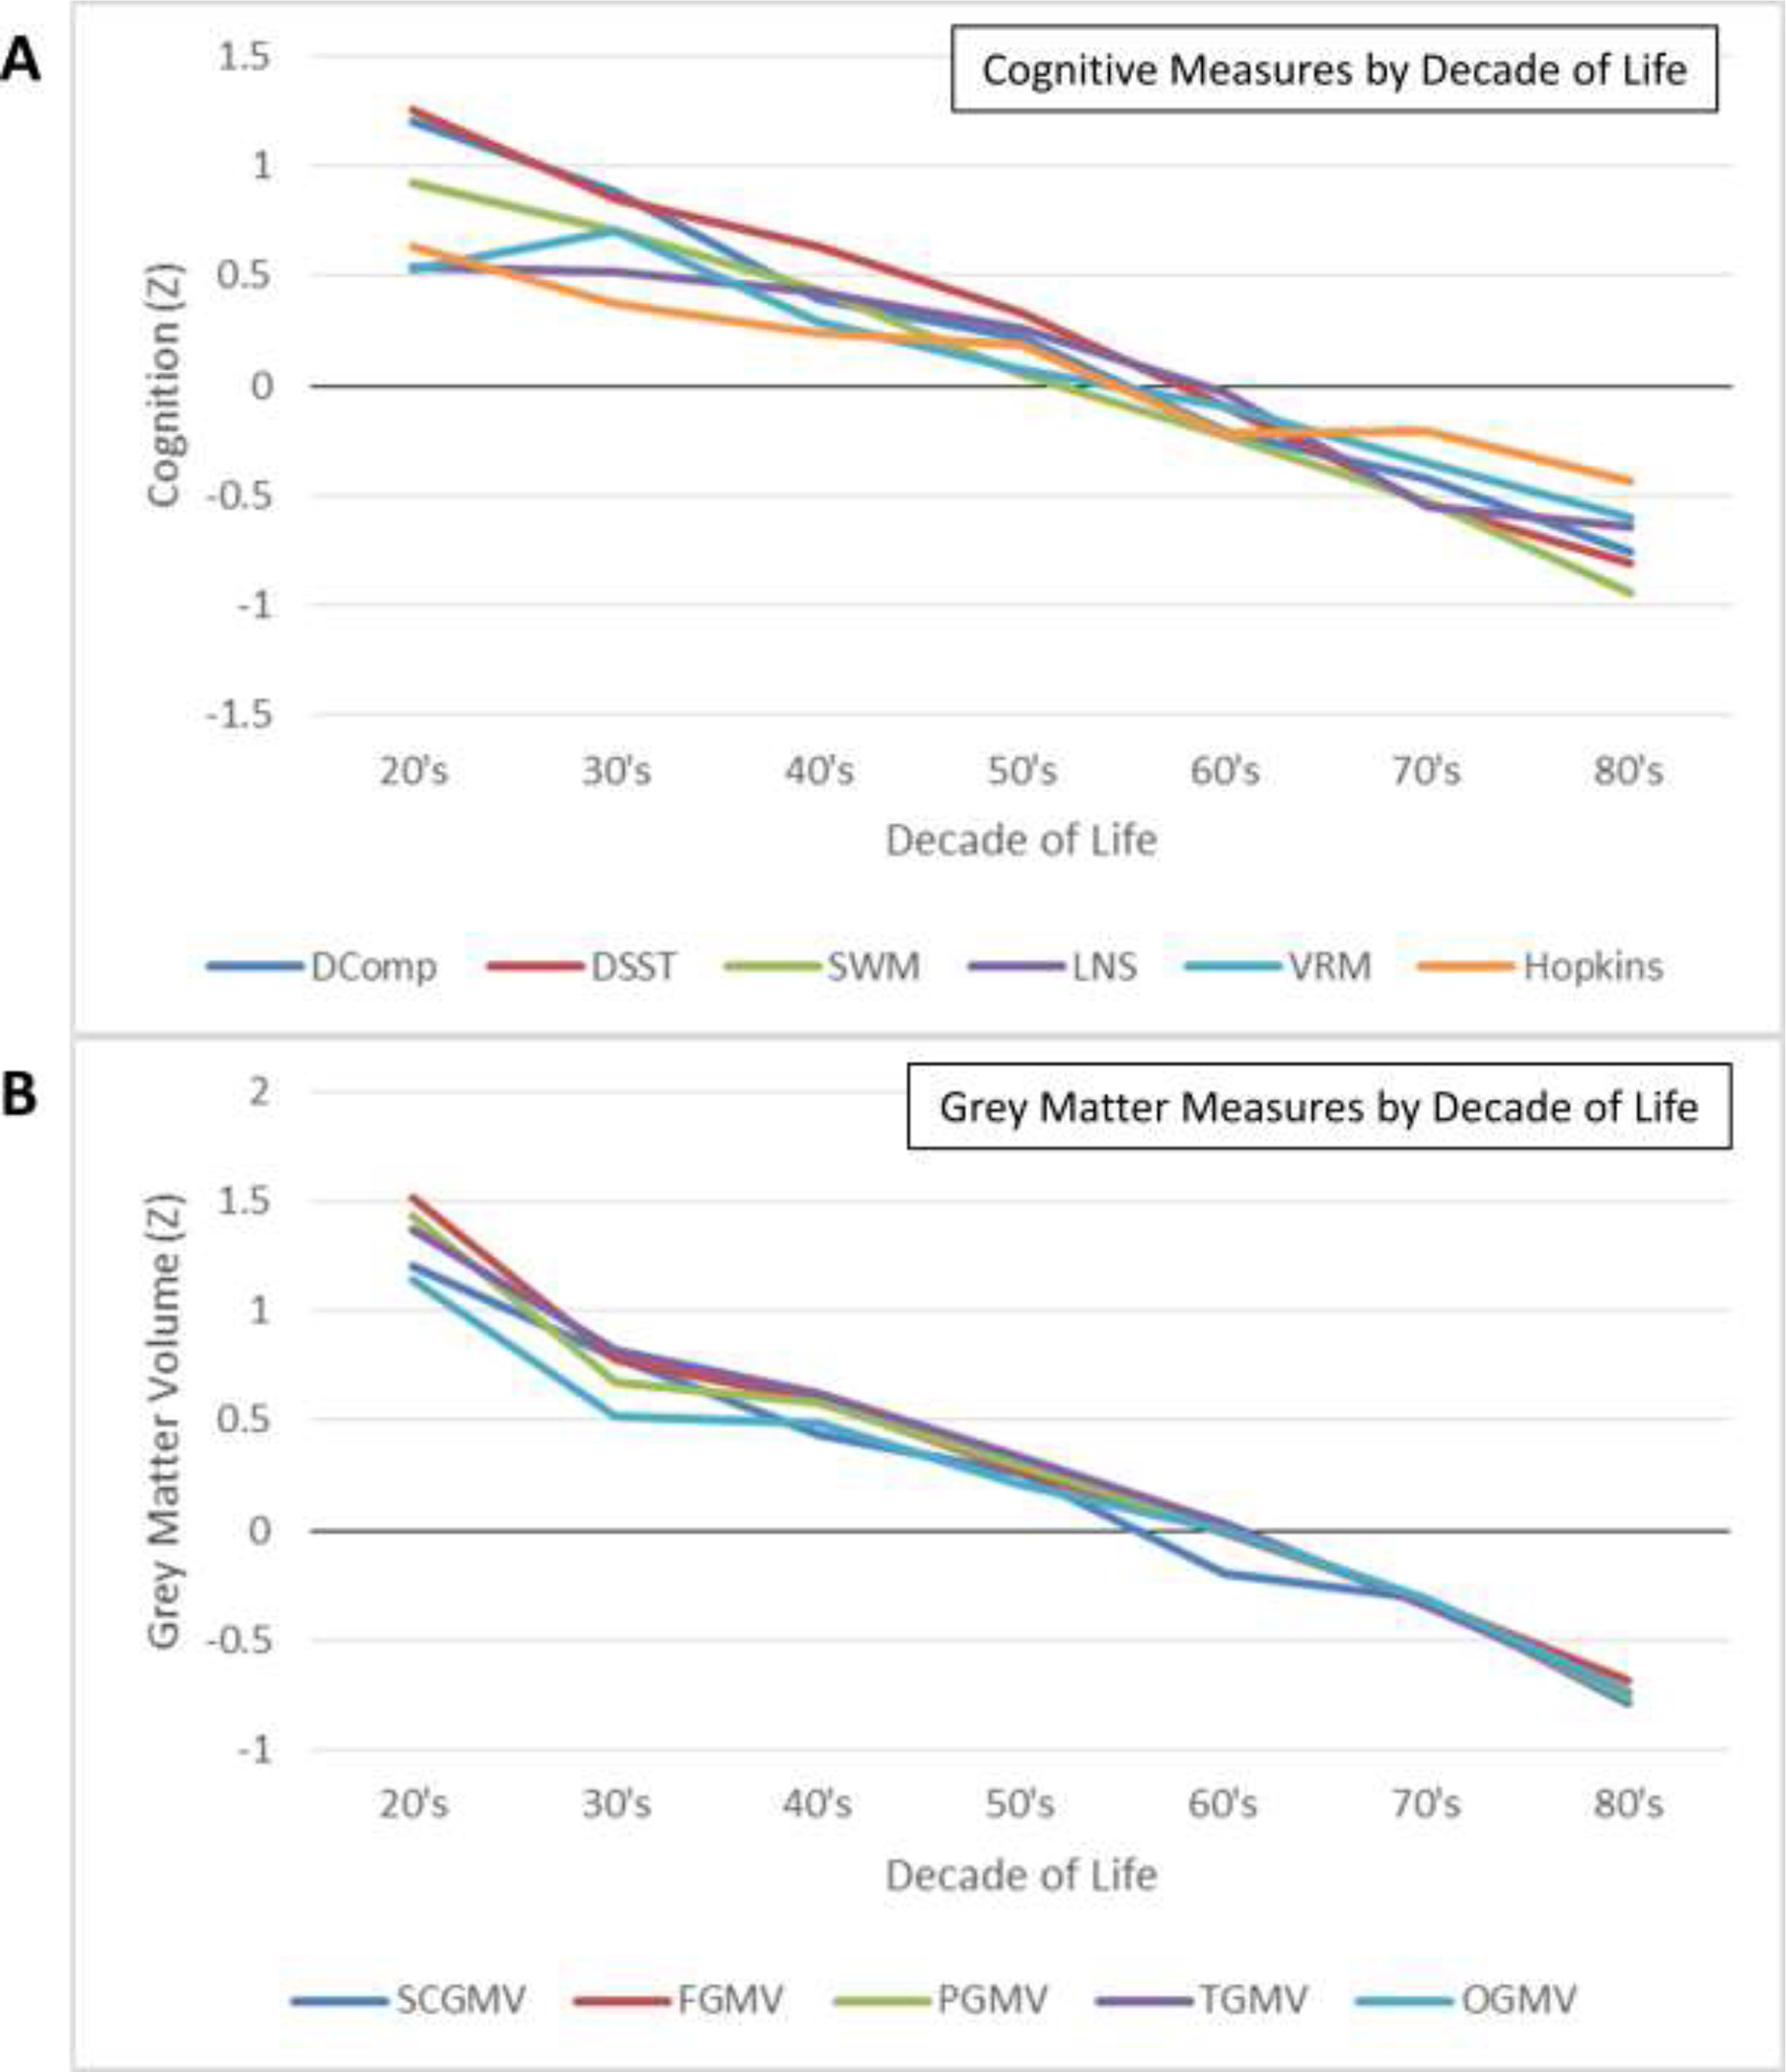
Cognitive (A) and structural (B) measures as assessed at Assessment time 1. All measures presented in normalized units (Z). Measures visualized on panel A include the digit comparison task (DComp), Digit-Symbol Substitution Test (DSST), Spatial Working Memory (SWM), Letter-Number Sequencing (LNS), Visual Recall Memory (VRM), and Hopkins Verbal Learning Test/HVLT (Hopkins). Measures visualize on panel B include standardized grey matter volume estimates of the frontal lobe (FGMV), parietal lobe (PGMV), temporal lobe (TGMV), occipital lobe (OGMV), and aggregate subcortical grey matter volume (SCGMV).
Mean cognitive measures (A) and grey matter volume (B) over time are visualized in Figures 3 and 4, respectively. In terms of grey matter volumes, decline was observed across the lifespan with mean patterns being approximately linear. Participants between 20 and 39 years of age at time of first assessment expressed steeper decline of cortical grey matter volume than what would be expected based on past literature (see Figure 3, panels A-D), although at least one study has reported a tendency for grey matter loss in the form of cortical thinning to slow over the adult lifespan (Rast et al., 2018). Our oldest participants (80+ years of age at time of first assessment) also appear to express slower decline than the other age bins visualized on Figure 3, particularly in the parietal and occipital lobes (panels B and C), though this is very likely the expression of survivorship bias as only the healthiest octogenarians are likely to be able volunteer for a longitudinal cognitive assessment.
Figure 3. Grey Matter Volume by Age (Years).
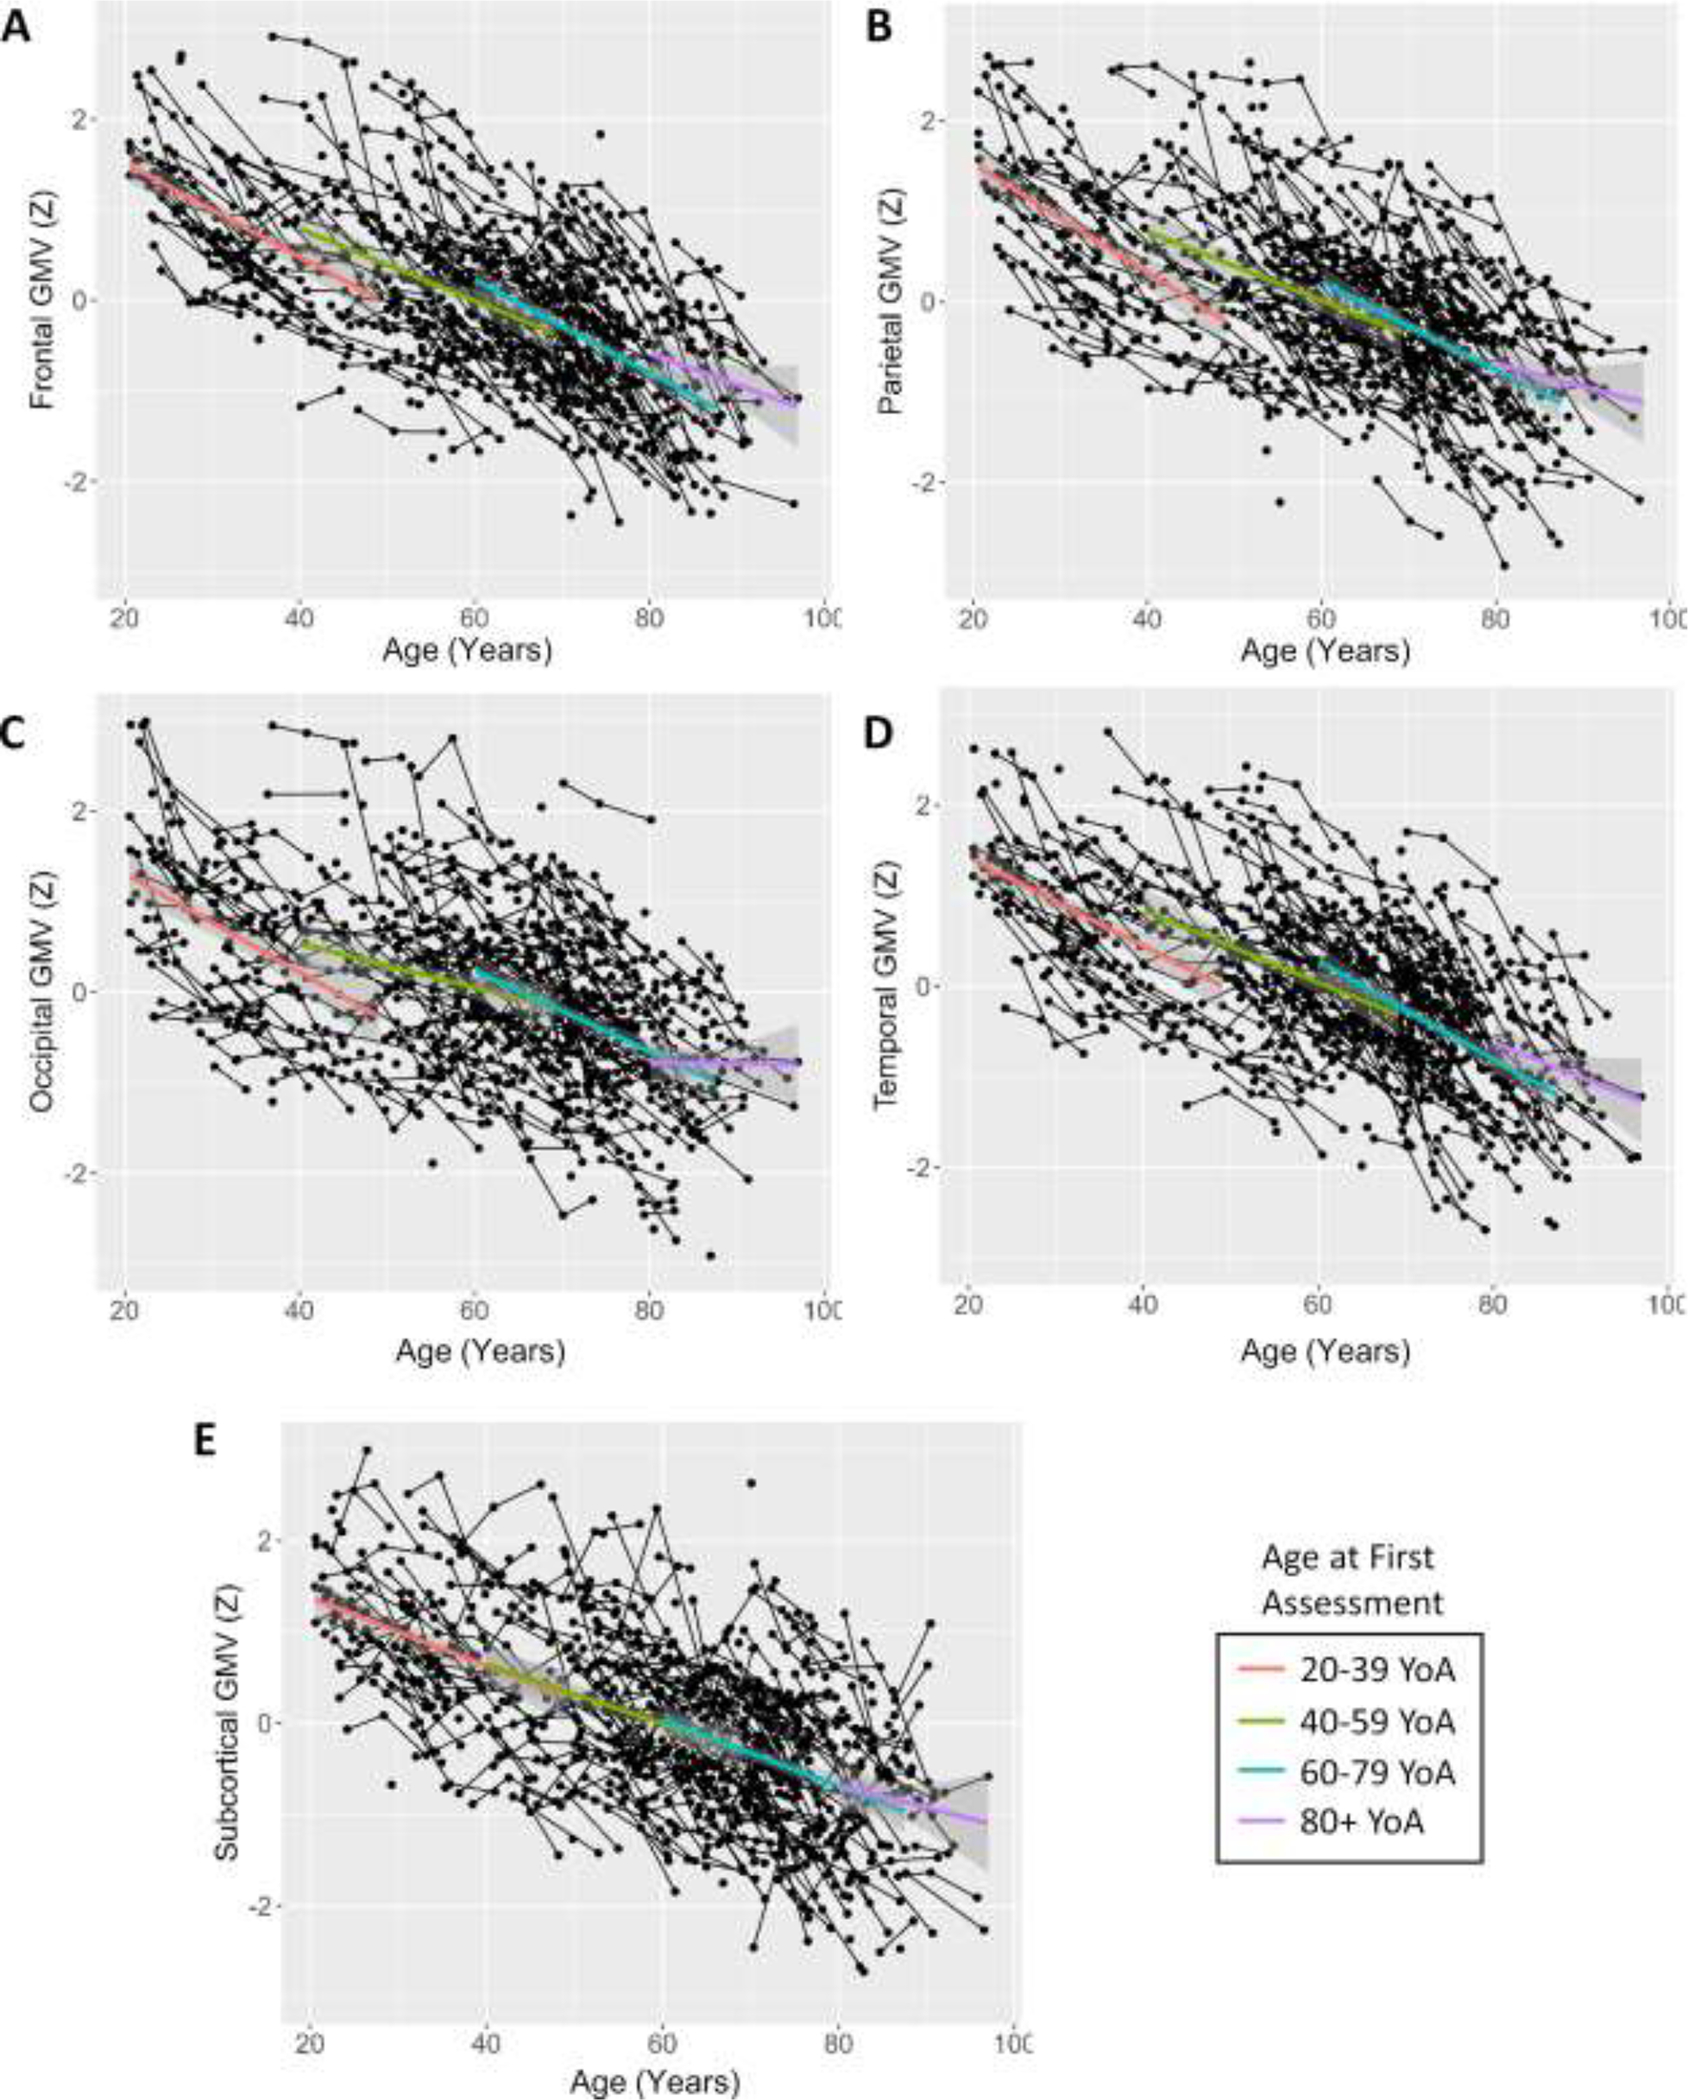
Frontal (A), parietal (B), occipital (C), temporal (D), and subcortical (E) grey matter volume over time and across age. Trend-lines represent mean value over time with 95% confidence intervals for each of the following age bins: 20–39, 40–59, 60–79, and 80+ years (age at first assessment). Age bins are for illustrative purposes only and were not utilized in analysis.
Figure 4. Cognitive Measures by Age (Years).
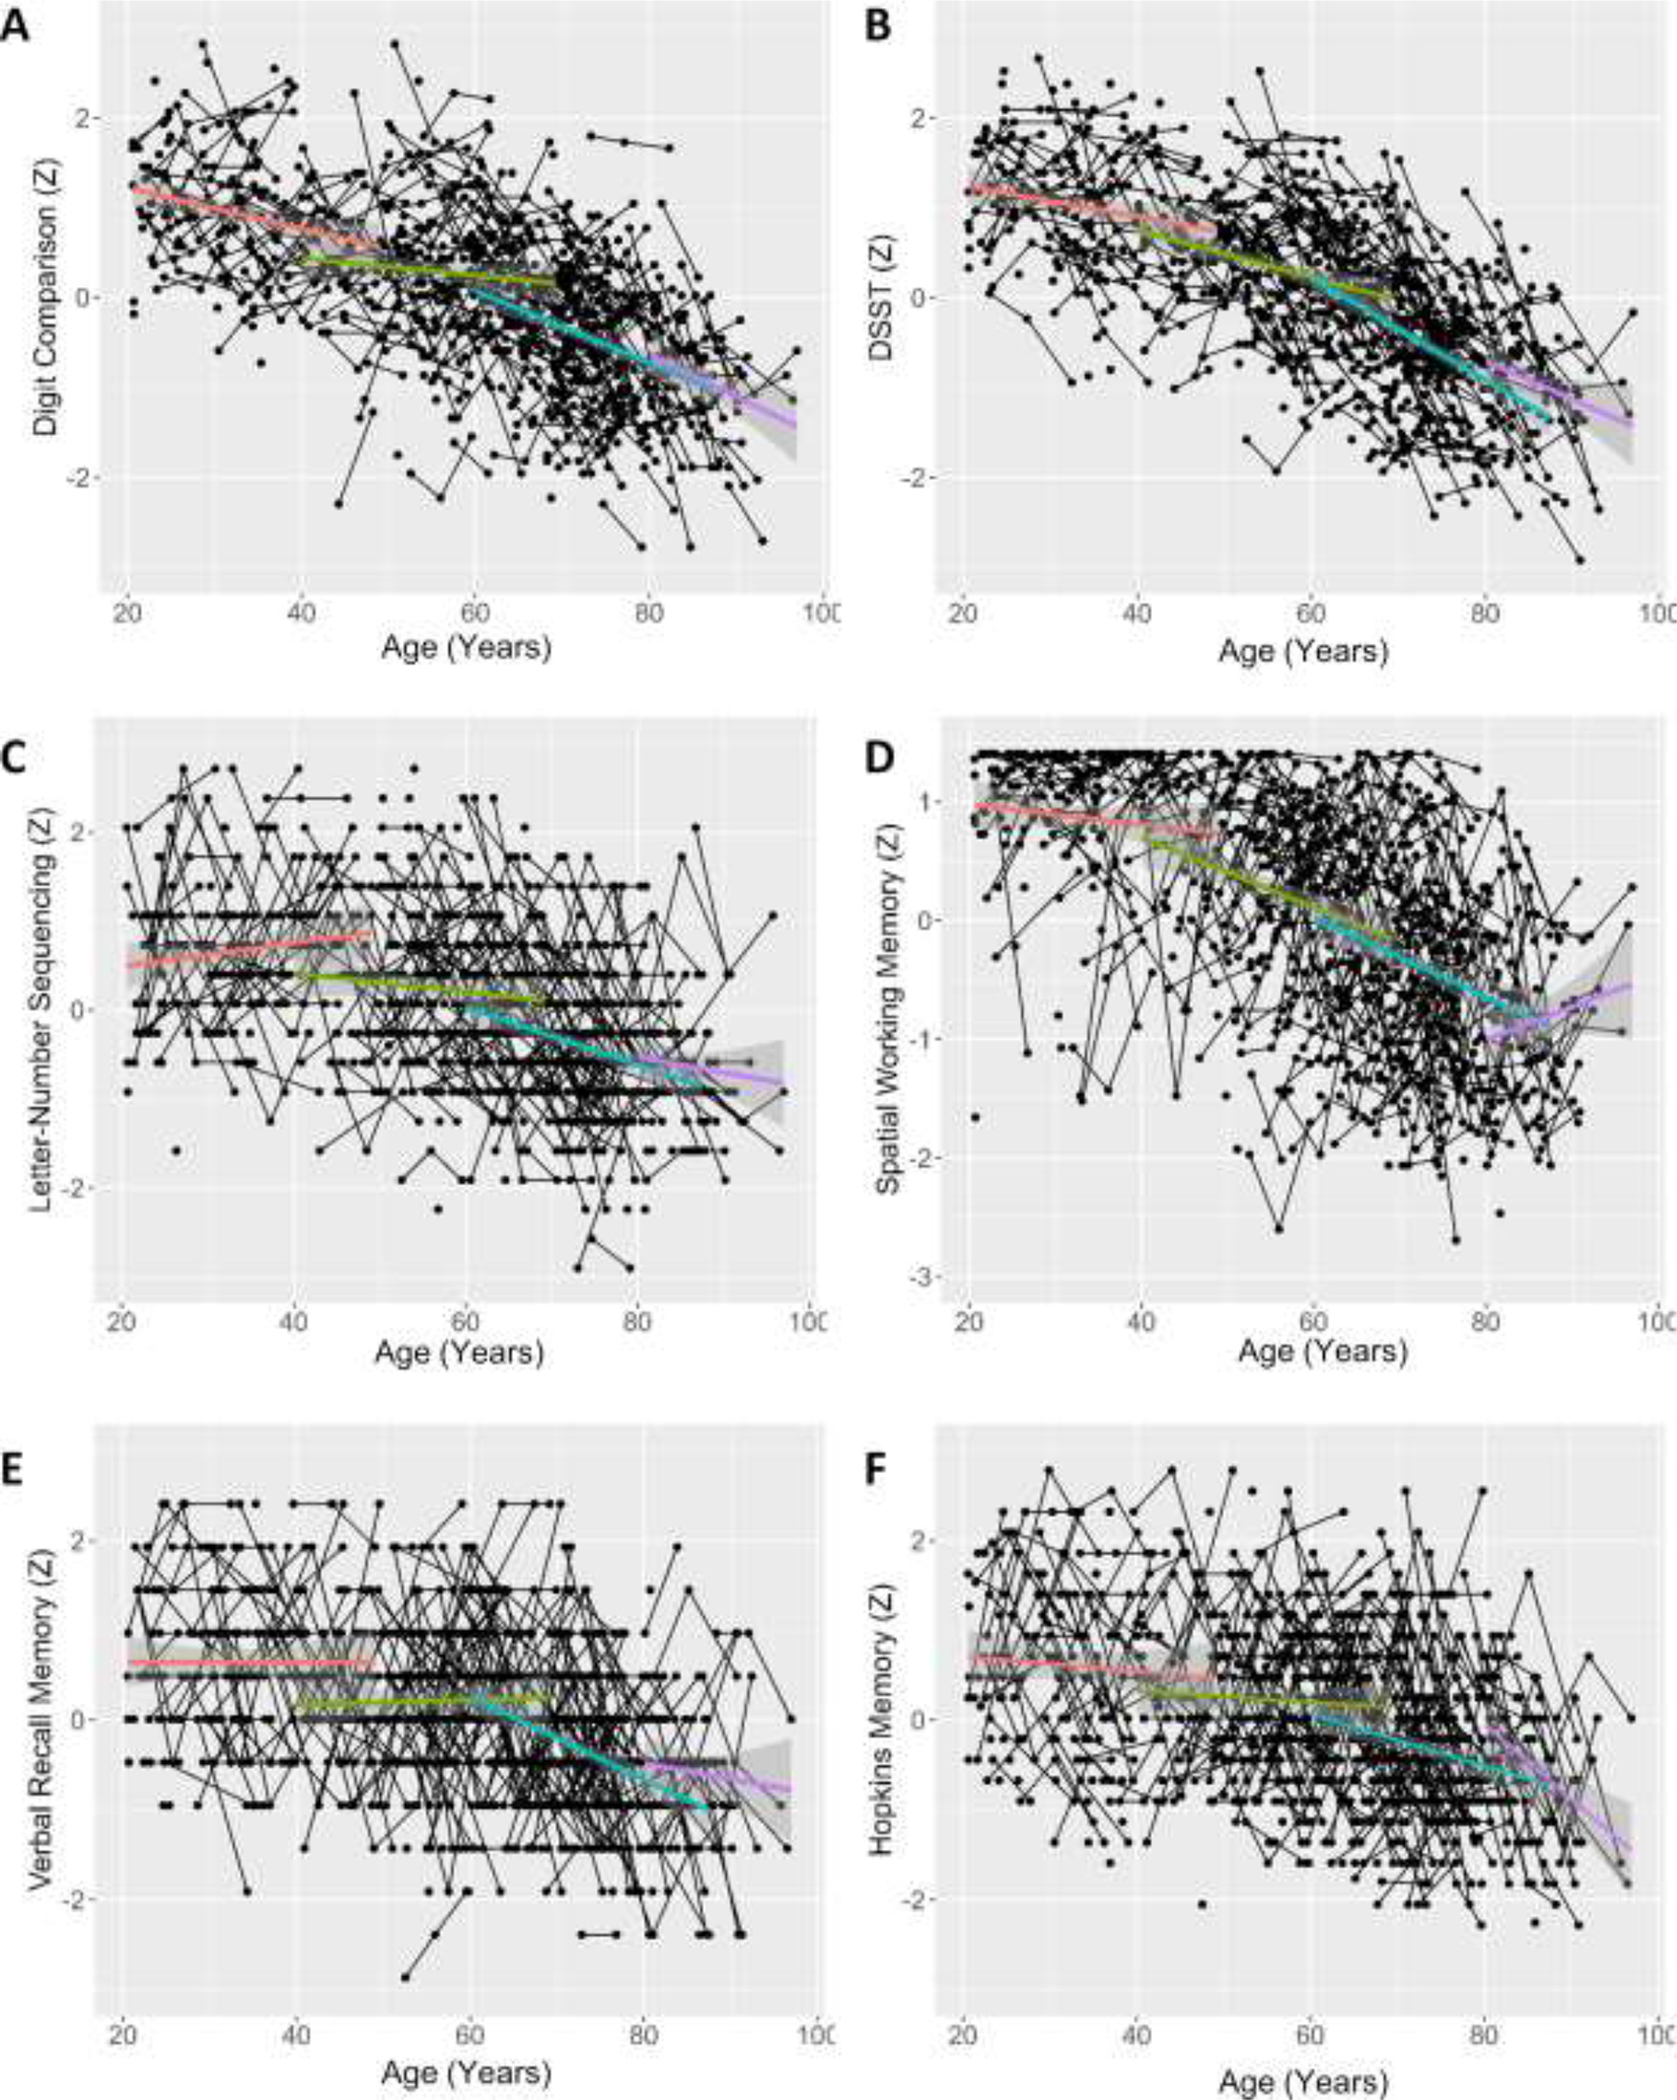
Digit Comparison (A), DSST (B), Letter-Number Sequencing (C), Spatial Working Memory (D), and Verbal Recall Memory (E), and HVLT (F) standardized performance over time and across age. Trend-lines represent mean value over time with 95% confidence intervals for each of the following age bins: 20–39, 40–59, 60–79, and 80+ years (age at first assessment). Age bins are for illustrative purposes only and were not utilized in analysis.
In terms of cognitive measures, all examined tasks demonstrate the expected pattern of increasing speed of decline with age (see Figure 4), which is most pronounced in our working and episodic memory measures (panels C-F). Again, our oldest participants appear to decline slower than other groups on several of these measures, reflecting a likely survivorship bias in our 80+ sample.
3.4. Univariate Growth Models.
As shown in Table 3, both general cognition and cortical grey matter were best fit by models that demonstrated a negative linear slope as a function of time (assessments 1–3), as well as significant variance in both intercept and slope. The reliable intercept variances reflect expected individual differences in level of cognition. The reliable slope variances suggest that there are measurable amounts of individual differences in rate-of-change of these two variables, even though the mean slopes show both variables decrease on average over time. The model fit to subcortical GMV also demonstrated a significant negative linear slope, but only demonstrated significant variance in intercept, not slopes.
Table 3.
Parameter Estimates for Univariate Growth Models
| General Cognition | CGMV | SCGMV | ||||
|---|---|---|---|---|---|---|
| β (SE) | p | β (SE) | p | β (SE) | p | |
|
| ||||||
| Mean | ||||||
| Intercept | .05 (.04) | .176 | .18 (.05) | <.001 | .09 (.05) | .04 |
| Slope | −.16 (.02) | <.001 | −.35 (.02) | <.001 | −.2 (.02) | <.001 |
| Variance | ||||||
| Intercept | .61 (.06) | <.001 | 1.01 (.07) | <.001 | .88 (.06) | <.001 |
| Slope | .03 (.01) | <.001 | .07 (.01) | <.001 | .011 (.01) | .169 |
| Covariance | ||||||
| Int. by Slope | .04 (.01) | .004 | −.05 (.02) | .002 | .02 (.02) | .314 |
Interestingly, the univariate latent growth models fit to general cognition and CGMV both exhibited significant intercept-slope covariance, but in opposite directions. These models are shown in Table 3. Specifically, the GenCog model exhibited a positive intercept-slope covariance, while the CGMV model demonstrated a negative intercept slope covariance. Individuals with higher cognitive scores at baseline declined at a slower rate on general cognition than did participants with a lower cognitive scores at baseline. At the same time, higher cortical grey matter volume at baseline was associated with steeper volumetric decline. This is not an unprecedented finding: Rast et al., (2018) demonstrated, in a sample of 249 middle-aged and older adults, a reverse quadratic function of cortical thinning across the cortex over 8 years of assessment, i.e. a slowing of cortical thinning over time.
Although the univariate model was unable to reliably detect variance in the slope of subcortical grey matter change, it is likely that this finding reflects power issue rather than a true lack of individual variance of that term. In order to test this, we next conducted a 2-degrees of freedom generalized likelihood ratio test (Hertzog et al., 2008) to assess the power of the univariate growth model to detect variance in slope in the subcortical GMV dataset. This test trended towards significance, Χ2(2) = 4.76, p =.092. Considering this, we elected to retain the subcortical GMV variable in the full PLGC model presented below.
3.5. Parallel Latent Growth Curve Model
3.5.1. The Unconditional Model.
The parallel-process latent growth curve model combined the univariate growth models fit to cortical GMV, subcortical CMV, and general cognition and allowed those latent intercept and growth terms to be free to covary. This in turn allowed us to examine the degree to which change in these three variables was related with one another. The model demonstrated acceptable-to-good fit across all examined measures of fit (CFI = .91, RMSEA = .07, SRMR = .08). Factor loadings of measured variables to first-order latent variables in this model are reported in Table 4. Covariance estimates for this model are reported in Table 5. Note that this unconditional model was not corrected for age – age and the age*time interaction factor were accounted for in the Conditional model reported in section 3.5.2.
Table 4.
Contribution of Measured Variables to First-Order Latent Variables
| General Cognition measured variables | ||||
| β | SE | z | p | |
|
| ||||
| DComp | 1 | - | - | - |
| DSST | 1.1 | .04 | 26.64 | <.001 |
| SWM | .76 | .05 | 15.37 | <.001 |
| LNS | .77 | .05 | 15.79 | <.001 |
| VRM | .66 | .05 | 13.63 | <.001 |
| HVLT | .67 | .05 | 14.05 | <.001 |
|
| ||||
| Cortical Grey Matter Volume measured variables | ||||
| β | SE | Z | p | |
|
| ||||
| Frontal GMV | 1 | - | - | - |
| Parietal GMV | .95 | .01 | 70.03 | <.001 |
| Temporal GMV | .98 | .01 | 67.95 | <.001 |
| Occipital GMV | .78 | .02 | 37.74 | <.001 |
Note. First-order latent variables were calculated for both general cognition and cortical grey matter volume at each assessment. Factor contributions were constrained to be equal across waves.
Table 5.
Parameter Estimates Describing Parallel Growth in Cortical GMV, Subcortical GMV, and General Cognition
| Within-Domain Covariances | ||||
| β | SE | z | p | |
|
| ||||
| GenCogi with GenCogs | .04 | .01 | 3.18 | .001 |
| CGMVi with CGMVs | −.05 | .02 | −3.07 | .002 |
| SCGMVi with SCGMVs | .03 | .02 | 1.54 | .124 |
|
| ||||
| Intercept-Intercept Covariances | ||||
| β | SE | Z | p | |
|
| ||||
| GenCogi with CGMVi | .4 | .05 | 8.79 | <.001 |
| GenCogi with SCGMVi | .34 | .04 | 8.02 | <.001 |
| CGMVi with SCGMVi | .77 | .06 | 13.11 | <.001 |
|
| ||||
| Cross-Domain Intercept-Slope Covariances | ||||
| β | SE | Z | p | |
|
| ||||
| GenCogi with CGMVs | .02 | .01 | 1.77 | .076 |
| GenCogi with SCGMVs | .03 | .02 | 2.13 | .033 |
| CGMVi with GenCogs | .06 | .02 | 3.6 | <.001 |
| CGMVi with SCGMVs | .05 | .02 | 2.6 | .009 |
| SCGMVi with GenCogs | .06 | .01 | 4 | <.001 |
| SCGMVi with CGMVs | .002 | .02 | .12 | .902 |
|
| ||||
| Slope-Slope Covariances | ||||
| β | SE | z | p | |
|
| ||||
| GenCogs with CGMVs | .01 | .004 | 2.45 | .014 |
| GenCogs with SCGMVs | .01 | .004 | 2 | .046 |
| CGMVs with SCGMVs | .01 | .01 | 1.65 | .098 |
3.5.2. The Conditional Model Accounting for Age and Age*Time.
After fitting the unconditional parallel linear growth curve model, we next fit a conditional PLGC model controlled for the effects of age as well as the age*time interaction, as explained in section 2.4.3.3. This conditional model also demonstrated acceptable-to-good fit across all examined measures of fit (CFI = .91, RMSEA = .07, SRMR = .07). Covariance estimates for the conditional model are reported in Table 6.
Table 6.
Parameter Estimates Describing Parallel Growth Model After Accounting for Age and Age by Time Interaction.
| Within-Domain Covariances | ||||
| β | SE | z | p | |
|
| ||||
| GenCogi with GenCogs | −.02 | 0.01 | −1.93 | 0.054 |
| CGMVi with CGMVs | −.07 | 0.01 | −5.53 | <.001 |
| SCGMVi with SCGMVs | ~0 | 0.01 | −0.04 | 0.971 |
|
| ||||
| Intercept-Intercept Covariances | ||||
| β | SE | Z | p | |
|
| ||||
| GenCogi with CGMVi | .02 | .02 | .993 | .321 |
| GenCogi with SCGMVi | −.01 | .02 | −.319 | .75 |
| CGMVi with SCGMVi | .002 | .01 | .188 | .851 |
|
| ||||
| Cross-Domain Intercept-Slope Covariances | ||||
| β | SE | Z | p | |
|
| ||||
| GenCogi with CGMVs | .003 | .01 | .35 | .724 |
| GenCogi with SCGMVs | .01 | .01 | .5 | .616 |
| CGMVi with GenCogs | −.003 | .01 | −.25 | .802 |
| CGMVi with SCGMVs | .02 | .01 | 1.46 | .144 |
| SCGMVi with GenCogs | .002 | .01 | .19 | .851 |
| SCGMVi with CGMVs | −.02 | .01 | −1.5 | .134 |
|
| ||||
| Slope-Slope Covariances | ||||
| β | SE | z | p | |
|
| ||||
| GenCogs with CGMVs | .01 | .004 | 2.08 | .038 |
| GenCogs with SCGMVs | .01 | .004 | 1.27 | .203 |
| CGMVs with SCGMVs | .02 | .013 | 1.46 | .144 |
|
| ||||
| Regression Coefficients | ||||
| β | SE | z | p | |
|
| ||||
| Age ~ GenCogi | −.65 | .05 | −12.59 | <.001 |
| Age ~ GenCogs | −.08 | .03 | −2.9 | .004 |
| Age~ CGMVi | −.67 | .07 | −10.12 | <.001 |
| Age~ CGMVs | −.04 | .03 | −1.35 | .177 |
| Age~ SCGMVi | −.57 | .07 | −8.67 | <.001 |
| Age~ SCGMVs | −.05 | .04 | −1.32 | .186 |
| Age*Time ~ GenCogi | .02 | .03 | 0.61 | .54 |
| Age*Time ~ GenCogs | .15 | .06 | 2.47 | .013 |
| Age*Time ~ CGMVi | .04 | .04 | 1.09 | .275 |
| Age*Time ~ CGMVs | .01 | .04 | .35 | .729 |
| Age*Time ~ SCGMVi | .01 | .04 | .34 | .736 |
| Age*Time ~ SCGMVs | .06 | .04 | 1.61 | .107 |
| Age2*Time ~ GenCogi | .06 | .04 | 1.58 | .115 |
| Age2*Time ~ GenCogs | −.13 | .06 | −2.1 | .036 |
| Age2*Time ~ CGMVi | .06 | .05 | 1.22 | .223 |
| Age2*Time ~ CGMVs | −.01 | .05 | −.11 | .913 |
| Age2*Time ~ SCGMVi | .002 | .05 | .036 | .971 |
| Age2*Time ~ SCGMVs | −.05 | .04 | −1.03 | .305 |
3.5.3. Relation of Variables at Baseline.
Assessment of the intercept-intercept covariances of the PLGC model allowed us to test if our calculated latent variables were related at a baseline level. The latent intercepts (i.e., baseline) of all the fit growth curves (CGMV, SCGMV, GenCog) were strongly inter-correlated, at p’s < .001 (see Table 5). The relationship was positive in all cases, indicating that individuals with higher cortical/subcortical grey matter volumes at baseline also tended to have higher cognition at baseline. However, these relationships dropped to non-significance after accounting for the direct effect of age and the age* time interaction on the latent intercepts (see Table 6), indicating that latent cognition, cortical GMV, and subcortical GMV are all independently related to participants’ Age.
3.5.4. Relation of Variables at Baseline to Rates of Change.
Assessment of the intercept-slope covariances of the PLGC model allowed us to test whether the examined variables at baseline were related to change in the examined variables over time. Looking at the relationship of baseline values of a given variables with rate of change of that variable, the within-domain intercept-slope covariances in the parallel-process model recapitulated those relationships seen in the univariate models. That is, latent intercept and slope of general cognition demonstrated a significant positive relationship (z = 3.18, p = .001) whereas latent intercept and slope of CGMV demonstrated a negative relationship (z = −3.07, p = .002). The within-domain intercept-slope covariance of subcortical GMV was not significant (z = 1.54, p = .12). These results indicate that a higher cognitive baseline was related to a slower decline in general cognition over the study, whereas a higher baseline cortical GMV was related to a faster decline in cortical GMV over the study. This negative relationship between cortical GMV baseline and rate of change persisted after controlling for age (z = −5.53, p <.001, see Table 6). This result suggests that the observed relationship is not due to aging alone, but rather that higher cortical volume baseline is associated with faster decline of cortical volume at any point in the adult lifespan. Interestingly, the intercept and slope of general cognition trended towards a significant, negative interaction in the conditional model as well (z = −1.93, p =.054), demonstrating that not only was the previously observed positive covariance a likely age effect, but that above-and-beyond age, cognition may show a similar pattern of increased rate of atrophy with greater initial ability. Considering that both cortical GMV and general cognition exhibit a negative relationship between baseline value and slope of change after controlling for age, this pattern of results may be indicative of regression to the mean.
A number of significant cross-domain relationships between baseline values and rate of change were also identified, all demonstrating positive associations. Specifically, the latent intercept of general cognition was positively related to the latent slope of subcortical GMV (z = 2.13, p = .033), the latent intercept of cortical GMV was positively related to the latent slopes of both general cognition and subcortical GMV (GenCogs z = 3.6, p <.001, SCGMVs z = 2.6, p = .009), and the latent intercept of subcortical GMV was positively related to the latent slope of cortical GMV (z = 4, p <.001). As all of these cross-domain intercept-slope covariances were positive, these results indicate that in all significant cases higher baselines were related to slower declines in the unconditional model. However, all of these associations were reduced to non-significance after controlling for age and age*time interaction (p <= .144 in all cases, see Table 6), suggesting the latent baselines of CGMV, SCGMV, and general cognition were serving as a proxy for age in these relationships.
3.5.5. Slope-Slope Covariances.
Assessment of the slope-slope covariance in our PLGC model allowed us to test if change over time in our examined latent variables was related to change in any other of the examined latent variables. Pertinent to our primary hypothesis, change in both cortical and subcortical GMV was positively related to change in general cognition (CGMV z = 2.45, p = .014; SCGMV z = 2, p = .046), indicating that individual change in both GMV tended to align with individual change in cognition over the study. However, the latent slope of cortical and subcortical GMV did not significantly covary (z = 1.65, p = .098). The relationship between slope of general cognition and slope of cortical GMV remained significant even after accounting for the effects of age and the age*time interaction (z = 2.08, p = .038). This result supports our primary hypothesis that change in grey matter and change in cognition are coupled factors across the entire age range examined by this study.
3.5.6. Significance of Age and Age*Time Interaction Terms.
The conditional PLGC model allowed us both to examine relationships between latent variable in absence of age effects, but also to directly assess the power of age and the age*time interaction to explain variance in those variables. As reported on Table 6, the baseline age was found to significantly relate to the latent estimates of baseline cortical GMV (z = −10.12, p <.001), subcortical GMV (z = −8.67, p <.001), and general cognition (z = −12.59, p <.001). The negative direction of this association indicates a general reduction of all three capacities at older ages – at older ages individuals tended to have smaller (cortical and subcortical) grey matter volumes, and lower cognition. This age covariate was also significantly related to the slope of general cognition (z = −2.9, p = .004), again with a negative direction indicating faster loss of cognition in later life. This relationship is confirmed by the significant contribution of the linear and quadratic age*time interaction terms to the slope of latent cognition (linear z = 2.47, p = .013; quadratic z = −2.1, p = .036), indicating an increasing rate of cognitive decline at later ages and over time. Notably, these interaction terms did not significantly relate to either the latent cortical or subcortical GMV slope terms, suggesting that the rate of change in both grey matter measures is relatively linear throughout the lifespan.
4. Discussion
The major findings from this study are as follows, with each discussed below in turn: a) individual change in cortical and subcortical grey matter volume was reliably related to individual change in general cognitive performance; b) higher initial grey matter volume (both cortical and subcortical) and cognitive ability were associated with slower cognitive decline over the study period, though this effect was mitigated after accounting for age; c) latent general cognition demonstrated accelerated rate of decline in later life, but the latent grey matter measures did not, and; d) contrary to our hypothesis, there was evidence that higher initial cortical grey matter volume was related to faster decline in cortical GMV.
4.1. Grey Matter Change is Reciprocally Related to Cognitive Change at the Individual Level.
As discussed earlier in this manuscript, there is ample evidence tying longitudinal change in grey matter to cognitive function (Head et al., 2008; Lagnes et al., 2020; Nickl-Jockshat et al., 2012; Park & Reuter-Lorenz, 2009), particularly in older adults (Fletcher et al., 2018; Hunt et al., 2021; Vonk et al., 2022), and this relationship was replicated across the entire adult lifespan sample in the present study. Specifically, the parallel process model fit to our data demonstrated a strong, positive covariance between cognitive change over time and cortical grey matter volume change over time – in other words, individuals who lost more grey matter also lost more cognitive function. Similarly, those who declined in cognition showed a decrease in grey matter. Importantly, this relationship was significant after accounting for the effects of age, indicating that this relationship between individual-level change in grey matter volume and cognition is exhibited regardless of age in the lifespan sample examined in this study. These findings add to the small body of work that has demonstrated that change in grey matter volume and change in cognition are related in samples that include middle-aged and younger adult participants (Lagnes et al., 2020; Persson et al., 2016; Vonk et al., 2022). This coupling of cognitive and grey matter change throughout the adult lifespan highlights the importance of identifying factors which may differentiate patterns of neurocognitive development in middle age or earlier, for the purpose of understanding how to engender cognitively healthy later life.
4.2. Accelerating Cognitive Decline and Stable Grey Matter Decline.
Our findings broadly replicated past findings regarding the trajectory of lifespan grey matter and cognitive decline (Bethlehem et al., 2022; Fjell et al., 2014, Salthouse, 2016; Verhaeghen & Salthouse, 1997), i.e. the rate of cognitive decline accelerated throughout the lifespan, while the rate of grey matter decline (both cortical and subcortical) remained linear. This pattern is discernible when visualizing the baseline measures used to calculate the latent GMV and cognitive slopes – lobular and subcortical grey matter volumes (see Figure 2A) demonstrated a clear linear decline, while individual cognitive measures (see Figure 2B) demonstrated varying degrees of acceleration over time. Interestingly, the four cortical volumes demonstrated very similar patterns of atrophy over time, validating our decision to use a single latent measure of aggregate cortical volume, and replicating previous findings suggesting that a widely-expressed mechanism of cortical atrophy is impactful on later life cognitive decline (Cox et al., 2021; Fletcher et al., 2018). This pattern of results, coupled with the significant relationship between cortical and cognitive change observed across all ages in this study, indicates that older adults are exhibiting relatively more cognitive change than younger adults coupled with an equivalent change in cortical GMV. While we did not directly assess directionality of these effects in our analysis, a possible interpretation of these results is that equivalent cortical atrophy has a larger effect on the cognitive ability of older adults compared to the cognitive ability of younger adults, if a grey matter -> cognition directional effect is assumed.
4.3. The Paradoxical Relationship of Cortical Volume to Cortical Atrophy and Cognitive Decline.
Somewhat unexpectedly, baseline cortical grey matter volume demonstrated opposite effects on the rate of cortical GMV and rate of cognitive decline – higher baseline cortical GMV was related to slower rates of cognitive decline, but faster rates of decline in cortical GMV over time at the individual level. This counterintuitive relationship between baseline cortical GMV and rate of cortical change is not entirely without precedent. As mentioned above, Rast et al. (2018) found a similar pattern of results to what the present study presents. Specifically, Rast et al. found that the rate of decline in cortical thickness was slowed throughout the observation period (~7 years) in all regions of interest examined in a middle-aged and older cohort. This pattern of slowing decline followed an inverse quadratic function, so that an individual with higher cortical thickness at any given time point was likely to express a greater rate of thickness loss – highly similar to the pattern we see in the present study. However, if this pattern was expressed universally in our sample, we would expect younger adults on average to decline more rapidly than older adults over the same span of time (considering the higher individual GMV of younger adults than older, on average). The lack of a significant age or age*time effect on the slope of cortical GMV loss suggests that this is not the case – on average, the rate of cortical GMV loss appears to be stable across the adult lifespan, while at the individual level higher baseline cortical GMV is related to faster atrophy. A parsimonious explanation of such a finding would be regression towards the mean – a pattern of extreme scores falling closer to the group average at later assessments could lead to this pattern of a greater negative slope of CGMV change associated with higher baseline values. This finding will need to be replicated to verify that it is reliable.
Conversely, higher baseline cortical GMV was related to a slower rate of cognitive decline in the unconditional PLGC model. While this relationship might be interpreted as some sort of protective factor, the effect was entirely accounted for after including the age covariate in the conditional PLGC model. Therefore, this relationship is likely age-mediated – younger participants tended to have higher cortical grey matter volume coupled with slower cognitive decline.
4.4. Contribution of Measured to Latent Variables
A key benefit of using the parallel process models implemented above, aside from allowing us to examine patterns of covariance among our variables of interest, is that it allowed us to assess the relative contribution of our measured variables to the latent variables calculated in the model. In terms of cognitive measures, the two included measures of processing speed (Digit Comparison and DSST) had relatively stronger contribution to the calculated latent cognition variable than did any of our other cognitive measures (β = ~1.1 vs β = ~.7, see Table 4). This is an interesting finding in light of the known sensitivity of processing speed measures to age-related cognitive decline (Salthouse, 1996). However, the significant contribution of all six measures to the latent cognition construct suggest that what we are capturing in the present study is indeed a broad cognitive construct, rather than a speed-dominated one.
In terms of cortical grey matter measures, occipital volume was found to be underrepresented in the latent cortical volume construct compared to volume of the other three lobes (β = ~.7 vs β = ~1). This relative lack of contribution of the occipital lobe to the latent cortical grey matter construct may be a reflection of relatively little variance over time in occipital regions of the brain, as has been documented by earlier studies (Raz et al., 2005; Raz & Kennedy, 2009), though note that occipital volume in our sample does express decline over time (see Figure 1, panel D and Table 1). Occipital volume did significantly contribute to the cortical GMV construct despite this relatively lower weighting, indicating a reduced but still present contribution of occipital volume variance to the latent cortical variable examined in the model above.
4.5. Implications for Theories of Cognitive Aging
The key finding of this paper is that the processes of cortical grey matter loss and cognitive decline are coupled on an individual level, not just in later life but across the adult lifespan. The implication of this finding is that the processes which serve to differentiate individual patterns of neurocognitive decline are similarly operating throughout the lifespan. Aging research has been incrementally bolstering our understanding of the nature of cognitive and structural change in midlife and earlier, and the results of the present study further emphasize the importance of understanding cognitive and brain aging as a lifelong process, where earlier deviations in cognitive and brain health may very well have downstream consequences on cognitive performance in later age.
We note that the findings are partially supportive of the Scaffolding Theory of Aging and Cognition (STAC) proposed by Park and Reuter-Lorenz (2009) and revised by Reuter-Lorenz and Park (2014). The model proposes that the cognitive and structural decline observed exhibit bidirectional influences which serve to differentiate induvial patterns of decline – structural and functional alterations lead to age-related cognitive decline, while scaffolding processes operating in the functional (i.e., compensatory recruitment), structural (i.e., neurogenesis), and cognitive (i.e., learning, strategy adoption) domains work to counteract this decline. The revised STAC model presented in 2014 (Reuter-Lorenz & Park, 2014) further posits that these opposing enrichment and depletion processes are lifespan processes, rather than only impactful in later life. The findings of the present study validate specifically the individual coupling of structural and cognitive change factors proposed by the STAC model, as well as that this relationship is relevant throughout the adult lifespan. Importantly, the present study does not allow us to disambiguate between compensatory and decline processes – the covariance of individual rates of cortical and cognitive change supports that these processes are reciprocally linked, but this does not grant us any insight onto the specific mechanisms influencing individual patterns of decline. These mechanisms are in all likelihood heterogeneous between individuals – one participant showing a slow rate of decline may be engaging in successful scaffolding procedures, while another might experience slower rates of neurocognitive change due to preexisting (genetic/environmental) advantages, for example. Further study is needed to disambiguate these competing influences on neurocognitive decline processes.
4.6. Limitations and Future Directions
As with any study, the present results should be interpreted with consideration of its limitations. First, retention was found to be related to higher cognitive performance and more robust grey matter at baseline assessment across nearly all measures examined (see Table 1 and supplementary section S.2), indicating that cognitively healthier individuals with more baseline grey matter were more likely to return for following assessments. Practically, this means that we have, in all likelihood, underestimated the rate of both cognitive and structural decline observed in this study, as only those individuals who expressed less decline in either or both categories returned for follow-up assessments. This implies that our results are most generalizable to a healthier sample. This is not an unprecedented finding (Rast et al., 2018; Salthouse, 2014), and indeed this self-selection of healthier retained participants is a confound relevant to most if not all longitudinal studies in the field. A second limitation is that, despite the large sample size, our model was sufficiently complex to preclude statistically powerful investigation of subgroup effects within this model, which inhibited our ability to examine specific effects. We can best address this issue by designing simpler models with lower power requirements than the present model, although the models will likely have lower correspondence to actual brain/behavior relationships than the present more complex model does. A promising approach to solving the power problem will be to adopt a large, collaborative effort to aggregate MRI data from multiple such longitudinal studies of cognitive aging, as Bethlehem et al., 2022 did. Overcoming recruitment and retention hurdles is a perennial challenge in longitudinal research, and while large efforts such as the DLBS and many others have succeeded in creating usable datasets that have produced insightful results, the limitations of the present paper are representative of the limitations that most such studies face.
Supplementary Material
Highlights.
Individual change in grey matter volume was related to change in general cognition.
Higher grey matter volume and cognition were related to slower cognitive decline.
General cognition demonstrated accelerated rate of decline in later life.
Grey matter demonstrated a constant rate of decline across all age ranges.
Acknowledgments
Funding Statement
This work was supported by The National Institutes of Health: National Institute on Aging Grant to D. Park (AGO-06265).
Footnotes
Declaration of Competing Interest
The authors declare no actual or potential conflicts of interest.
Ethics Statement
All procedures described in this manuscript were performed under the oversight and with the approval of the Ethics Review Board (ERB) of the University of Texas at Dallas. All participants provided informed consent prior to involvement in the study.
CRediT Author Statement
Evan T. Smith: Meothodology, Formal Analysis; Data Curation; Writing – Original Draft, Visualization; Joseph P. Hennesse: Validation, Data Curation, Writing – Review & Editing, Project Administration; Gagan Wig: Writing – Review & Editing, Supervision; Sarah Frank: Investigation, Data Curation, Supervision; Julia Bacci: Investigation, Data Curation, Project Administration; Hector Gonzales: Investigation; Micaela Chan: Investigation, Data Curation; Claudia A. Carreno: Investigation; Chris Hertzog: Methodolgy, Formal Analysis, Writing - Review and Editing, Supervision; Kristen M. Kennedy: Conceptualization, Writing – Review & Editing; Karen M. Rodrigue: Conceptualization, Writing – Review & Editing; Denise C. Park: Conceptualization, Methodology, Resources, Writing – Review & Editing, Supervision, Funding Acquisition.
Verification Statement
The authors of this work verify that the work described in this manuscript has not been published previously and is not under consideration for publication in other venues. All co-authors, including Joseph P. Hennessee, Gagan Wig, Sarah Frank, Hector Gonzalez, Julia Bacci, Micaela Chan, Claudia A. Carreno, Kristen M. Kennedy, Karen M. Rodrigue, Christopher Hertzog, and Denise C. Park have grated the submitting author (Evan T. Smith) approval to submit this work. If accepted, the submitted work will not be published elsewhere without the consent of the copywrite holder.
Publisher's Disclaimer: This is a PDF file of an unedited manuscript that has been accepted for publication. As a service to our customers we are providing this early version of the manuscript. The manuscript will undergo copyediting, typesetting, and review of the resulting proof before it is published in its final form. Please note that during the production process errors may be discovered which could affect the content, and all legal disclaimers that apply to the journal pertain.
Data Availability
Data and analysis scripts used in this study are available upon request to the corresponding author, and the DLBS dataset will be made publicly available in the future.
References
- Basak C, Qin S, & O’Connell MA (2020). Differential effects of cognitive training modules in healthy aging and mild cognitive impairment: A comprehensive meta-analysis of randomized controlled trials. Psychology and Aging, 35(2), 220–249. 10.1037/pag0000442.supp (Supplemental) [DOI] [PMC free article] [PubMed] [Google Scholar]
- Beaton D, Fatt CRC, & Abdi H (2014). An ExPosition of multivariate analysis with the singular value decomposition in R. Computational Statistics & Data Analysis, 72, 176–189. 10.1016/j.csda.2013.11.006 [DOI] [Google Scholar]
- Bethlehem RAI, Seidlitz J, White SR, Vogel JW, Anderson KM, Adamson C, Adler S, Alexopoulos GS, Anagnostou E, Areces-Gonzalez A, Astle DE, Auyeung B, Ayub M, Bae J, Ball G, Baron-Cohen S, Beare R, Bedford SA, Benegal V, & Beyer F (2022). Brain charts for the human lifespan. Nature, 604(7906), 525–533. 10.1038/s41586-022-04554-y. [DOI] [PMC free article] [PubMed] [Google Scholar]
- Brandt J (1991). The Hopkins Verbal Learning Test: Development of a new memory test with six equivalent forms. The Clinical Neuropsychologist, 5(2), 125–142. 10.1080/13854049108403297. [DOI] [Google Scholar]
- Chan MY, Na J, Agres PF, Savalia NK, Park DC, & Wig GS (2018). Socioeconomic status moderates age-related differences in the brain’s functional network organization and anatomy across the adult lifespan. Proceedings of the National Academy of Sciences of the United States of America, 115(22), E5144–E5153. 10.1073/pnas.1714021115. [DOI] [PMC free article] [PubMed] [Google Scholar]
- Chan MY, Park DC, Savalia NK, Petersen SE, & Wig GS (2014). Decreased segregation of brain systems across the healthy adult lifespan. PNAS Proceedings of the National Academy of Sciences of the United States of America, 111(46), E4997–E5006. 10.1073/pnas.1415122111. [DOI] [PMC free article] [PubMed] [Google Scholar]
- Cox SR, Harris MA, Ritchie SR, Buchanan CR, Hernández MV, Corley J, Taylor AM, Madole JW, Harris SE, Whalley AM, McIntosh AM, Russ TC, Bastin ME, Wardlaw JM, Deary IJ, & Tucker-Drob EM (2021). Three major dimensions of human brain cortical ageing in relation to cognitive decline across the 8th decade of life. Molecular Psychiatry 26(6), 2651–2662. 10.1038/s41380-020-00975-1 [DOI] [PMC free article] [PubMed] [Google Scholar]
- Cox SR, Ritchie SJ, Fawns-Ritchie C, Tucker-Drob EM, & Deary IJ (2019). Structural brain imaging correlates of general intelligence in UK Biobank. Intelligence, 76. 10.1016/j.intell.2019.101376. [DOI] [PMC free article] [PubMed] [Google Scholar]
- Dale AM, Fischl B, Sereno MI, (1999). Cortical surface-based analysis. I. Segmentation and surface reconstruction. Neuroimage, 9, 179–194. 10.1006/nimg.1998.0395. [DOI] [PubMed] [Google Scholar]
- Dale AM, Sereno MI, 1993. Improved localization of cortical activity by combining EEG and MEG with MRI cortical surface reconstruction: a linear approach. Journal of Cognition and Neuroscience, 5, 162–176. [DOI] [PubMed] [Google Scholar]
- Duncan TE, Duncan SC, & Strycker LA (2013). An introduction to latent variable growth curve modeling: Concepts, issues, and application: New York, NY: Routledge Academic Press. [Google Scholar]
- Fjell AM, Grydeland H, Wang Y, Amlien IK, Bartres-Faz D, Brandmaier AM, Düzel S, Elman J, Franz CE, Håberg AK, Kietzmann TC, Kievit RA, Kremen WS, Krogsrud SK, Kühn S, Lindenberger U, Macía D, Mowinckel AM, Nyberg L, … Walhovd KB (2021). The genetic organization of longitudinal subcortical volumetric change is stable throughout the lifespan. ELife, 10. 10.7554/eLife.66466. [DOI] [PMC free article] [PubMed] [Google Scholar]
- Fjell AM, Westlye LT, Grydeland H, Amlien I, Espeseth T, Reinvang I, Raz N, Dale AM, & Walhovd KB (2014). Accelerating cortical thinning: Unique to dementia or universal in aging? Cerebral Cortex, 24(4), 919–934. 10.1093/cercor/bhs379. [DOI] [PMC free article] [PubMed] [Google Scholar]
- Fischl B, Dale AM, (2000). Measuring the thickness of the human cerebral cortex from magnetic resonance images. Procedures of the National Academy of Sciences, USA 97, 11050–11055. 10.1073/pnas.200033797. [DOI] [PMC free article] [PubMed] [Google Scholar]
- Fischl B, Salat DH, Busa E, Albert M, Dieterich M, Haselgrove C, van der Kouwe A, Killiany R, Kennedy D, Klaveness S, Montillo A, Makris N, Rosen B, Dale AM, (2002). Whole brain segmentation: automated labeling of neuroanatomical structures in the human brain. Neuron 33, 341–355. 10.1016/s0896-6273(02)00569-x. [DOI] [PubMed] [Google Scholar]
- Fischl B, Salat DH, van der Kouwe AJ, Makris N, Segonne F, Quinn BT, Dale AM, (2004). Sequence-independent segmentation of magnetic resonance images. Neuroimage 23 Suppl 1, S69–84. 10.1016/j.neuroimage.2004.07.016. [DOI] [PubMed] [Google Scholar]
- Fischl B, Sereno MI, Dale AM, (1999). Cortical surface-based analysis. II: Inflation, flattening, and a surface-based coordinate system. Neuroimage 9, 195–207. 10.1006/nimg.1998.0396. [DOI] [PubMed] [Google Scholar]
- Fischl B, Sereno MI, Tootell RB, Dale AM, (1999). High-resolution intersubject averaging and a coordinate system for the cortical surface. Human Brain Mapping, 8, 272–284. . [DOI] [PMC free article] [PubMed] [Google Scholar]
- Fischl B, van der Kouwe A, Destrieux C, Halgren E, Segonne F, Salat DH, Busa E, Seidman LJ, Goldstein J, Kennedy D, Caviness V, Makris N, Rosen B, Dale AM, (2004). Automatically parcellating the human cerebral cortex. Cerebral Cortex, 14, 11–22. 10.1093/cercor/bhg087. [DOI] [PubMed] [Google Scholar]
- Fletcher E, Gavett B, Harvey D, Farias ST, Olichney J, Beckett L, DeCarli C, & Mungas D (2018). Brain volume change and cognitive trajectories in aging. Neuropsychology, 32(4), 436–449. 10.1037/neu0000447. [DOI] [PMC free article] [PubMed] [Google Scholar]
- Han X, Jovicich J, Salat D, van der Kouwe A, Quinn B, Czanner S, Busa E, Pacheco J, Albert M, Killiany R, Maguire P, Rosas D, Makris N, Dale A, Dickerson B, Fischl B, (2006). Reliability of MRI-derived measurements of human cerebral cortical thickness: the effects of field strength, scanner upgrade and manufacturer. Neuroimage, 32, 180–194. doi: 10.1016/j.neuroimage.2006.02.051. [DOI] [PubMed] [Google Scholar]
- Head D, Rodrigue KM, Kennedy KM, & Raz N (2008). Neuroanatomical and cognitive mediators of age-related differences in episodic memory. Neuropsychology, 22(4), 491–507. 10.1037/0894-4105.22.4.491. [DOI] [PMC free article] [PubMed] [Google Scholar]
- Hedden T, Park DC, Nisbett R, Ji LJ, Jing Q, & Jiao S (2002). Cultural variation in verbal versus spatial neuropsychological function across the life span. Neuropsychology, 16, 65–73. doi: 10.1037/0894-4105.16.1.65. [DOI] [PubMed] [Google Scholar]
- Hertzog C, & Nesselroade JR (2003). Assessing psychological change in adulthood: An overview of methodological issues. Psychology and Aging, 18, 639–657. doi: 10.1037/0882-7974.18.4.639. . [DOI] [PubMed] [Google Scholar]
- Hertzog C, von Oertzen T, Ghisletta P, & Lindenberger U (2008). Evaluating the power of latent growth curve models to detect individual differences in change. Structural Equation Modeling, 15(4), 541–563. 10.1080/10705510802338983. [DOI] [Google Scholar]
- Hong Z, Ng KK, Sim SKY, Ngeow MY, Zheng H, Lo JC, Chee MWL, & Zhou J (2015). Differential age-dependent associations of gray matter volume and white matter integrity with processing speed in healthy older adults. NeuroImage, 123, 42–50. 10.1016/j.neuroimage.2015.08.034. [DOI] [PubMed] [Google Scholar]
- Hu L, & Bentler PM (1999). Cutoff criteria for fit indexes in covariance structure analysis: Conventional criteria versus new alternatives. Structural Equation Modeling, 6, 1–55. 10.1080/10705519909540118. [DOI] [Google Scholar]
- Hunt JFV, Vogt NM, Jonaitis EM, Buckingham WR, Koscik RL, Zuelsdorff M, Clark LR, Gleason CE, Yu M, Okonkwo O, Johnson SC, Asthana S, Bendlin BB, & Kind AJH (2021). Association of Neighborhood Context, Cognitive Decline, and Cortical Change in an Unimpaired Cohort. Neurology, 96(20), e2500–e2512. 10.1212/WNL.0000000000011918. [DOI] [PMC free article] [PubMed] [Google Scholar]
- Jovicich J, Czanner S, Greve D, Haley E, van der Kouwe A, Gollub R, Kennedy D, Schmitt F, Brown G, Macfall J, Fischl B, Dale A, (2006). Reliability in multi-site structural MRI studies: effects of gradient non-linearity correction on phantom and human data. Neuroimage, 30, 436–443. 10.1016/j.neuroimage.2005.09.046. [DOI] [PubMed] [Google Scholar]
- Kremen WS, Elman JA, Panizzon MS, Eglit GML, Sanderson-Cimino M, Williams ME, Lyons MJ, & Franz CE (2022). Cognitive reserve and related constructs: A unified framework across cognitive and brain dimensions of aging. Frontiers in Aging Neuroscience, 14. 10.3389/fnagi.2022.834765 [DOI] [PMC free article] [PubMed] [Google Scholar]
- Lagnes E, Sneve MH, Sederevicius D, Amlien IK, Walhovd KB, & Fjell AM (2020). Anterior and posterior hippocampus macro- and microstructure across the lifespan in relation to memory—A longitudinal study. Hippocampus, 30(7), 678–692. 443. 10.1002/hipo.23189. [DOI] [PubMed] [Google Scholar]
- McArdle JJ, & Nesselroade JR (2014). Longitudinal Data Analysis Using Structural Equation Models. Washington, DC: American Psychological Association. 10.1037/14440-000. [DOI] [Google Scholar]
- Morrell CH, Brant LJ, & Ferrucci L (2009). Model choice can obscure results in longitudinal studies. The Journals of Gerontology. Series A, Biological Sciences and Medical Sciences, 64(2), 215–222. 10.1093/gerona/gln024. [DOI] [PMC free article] [PubMed] [Google Scholar]
- Mulder ER, de Jong RA, Knol DL, van Schijndel RA, Cover KS, Visser PJ, Barkhof F, & Vrenken H (2014). Hippocampal volume change measurement: Quantitative assessment of the reproducibility of expert manual outlining and the automated methods FreeSurfer and FIRST. NeuroImage, 92, 169–181. 10.1016/j.neuroimage.2014.01.058. [DOI] [PubMed] [Google Scholar]
- Nickl-Jockschat T, Kleiman A, Schulz JB, Schneider F, Laird AR, Fox PT, Eickhoff SB, & Reetz K (2012). Neuroanatomic changes and their association with cognitive decline in mild cognitive impairment: A meta-analysis. Brain Structure & Function, 217(1), 115–125. 10.1007/s00429-011-0333-x. [DOI] [PMC free article] [PubMed] [Google Scholar]
- Park DC, & Festini SB (2017). Theories of Memory and Aging: A Look at the Past and a Glimpse of the Future. The Journals of Gerontology. Series B, Psychological Sciences and Social Sciences, 72(1), 82–90. 10.1093/geronb/gbw066. [DOI] [PMC free article] [PubMed] [Google Scholar]
- Park DC, Lautenschlager G, Hedden T, Davidson NS, Smith AD, & Smith PK (2002). Models of visuospatial and verbal memory across the adult life span. Psychology and Aging, 17(2), 299–320. doi: 10.1037/0882-7974.17.2.299 [DOI] [PubMed] [Google Scholar]
- Park DC, & Reuter-Lorenz P (2009). The Adaptive Brain: Aging and Neurocognitive Scaffolding. Annual Review of Psychology, 60(1), 173–196. 10.1146/annurev.psych.59.103006.093656. [DOI] [PMC free article] [PubMed] [Google Scholar]
- Park D, & Smith ET (2022). Facilitation of Cognition in Older Adults: Traditional and Non-Traditional Approaches to Inducing Change. Medical Research Archives, 10(10). [Google Scholar]
- Park H, Kennedy KM, Rodrigue KM, Hebrank A, & Park DC (2013). An fMRI study of episodic encoding across the lifespan: Changes in subsequent memory effects are evident by middle-age. Neuropsychologia, 51(3). doi: 10.1016/j.neuropsychologia.2012.11.025. doi:10.1016/j.neuropsychologia.2012.11.025. [DOI] [PMC free article] [PubMed] [Google Scholar]
- Persson N, Ghisletta P, Dahle CL, Bender AR, Yang Y, Yuan P, Daugherty AM, & Raz N (2016). Regional brain shrinkage and change in cognitive performance over two years: The bidirectional influences of the brain and cognitive reserve factors. NeuroImage, 126, 15–26. 10.1016/j.neuroimage.2015.11.028. [DOI] [PMC free article] [PubMed] [Google Scholar]
- R Core Team, (2021). R: A language and environment for statistical computing. R Foundation for Statistical Computing, Vienna, Austria. [Google Scholar]
- Rast P, Kennedy KM, Rodrigue KM, Robinson PRAW, Gross AL, McLaren DG, Grabowski T, Schaie KW, & Willis SL (2018). APOEε4 genotype and hypertension modify 8-year cortical thinning: Five occasion evidence from the Seattle Longitudinal Study. Cerebral Cortex, 28(6), 1934–1945. 10.1093/cercor/bhx099 [DOI] [PMC free article] [PubMed] [Google Scholar]
- Raz N (2020). Brains, hearts, and minds: Trajectories of neuroanatomical and cognitive change and their modification by vascular and metabolic factors. In: Poeppel D, Mangun GR and Gazzaniga MS, Cognitive Neuroscience VI. MIT Press. [Google Scholar]
- Raz N; Kennedy KM. A systems approach to age-related change: Neuroanatomical changes, their modifiers, and cognitive correlates. In: Jagust W; D’Esposito M, editors. Imaging the Aging Brain. Oxford University Press; New York, NY: 2009. p. 43–70. [Google Scholar]
- Raz N, Lindenberger U, Ghisletta P, Rodrigue KM, Kennedy KM, & Acker JD (2008). Neuroanatomical correlates of fluid intelligence in healthy adults and persons with vascular risk factors. Cerebral Cortex, 18(3), 718–726. 10.1093/cercor/bhm108. [DOI] [PMC free article] [PubMed] [Google Scholar]
- Raz N, Lindenberger U, Rodrigue KM, Kennedy KM, Head D, Williamson A, Dahle C, Gerstorf D, & Acker JD (2005). Regional Brain Changes in Aging Healthy Adults: General Trends, Individual Differences and Modifiers. Cerebral Cortex, 15(11), 1679–1689. 10.1093/cercor/bhi044 [DOI] [PubMed] [Google Scholar]
- Raz N, Rodrigue KM, Kennedy KM, Head D, Gunning-Dixon F, & Acker JD (2003). Differential aging of the human striatum: longitudinal evidence. AJNR. American Journal of Neuroradiology, 24(9), 1849–1856. [PMC free article] [PubMed] [Google Scholar]
- Reuter-Lorenz PA, & Park DC (2014). How does it STAC up? Revisiting the Scaffolding Theory of Aging and Cognition. Neuropsychology Review, 24(3), 355–370. 10.1007/s11065-014-9270-9. [DOI] [PMC free article] [PubMed] [Google Scholar]
- Robbins TW, James M, Owen AM, Sahakian BJ, McInnes L, Rabbitt P (1994). Cambridge Neuropsychological Test Automated Battery (CANTAB): A factor analytic study of a large sample of normal elderly volunteers. Dementia, 5, 266–281. [DOI] [PubMed] [Google Scholar]
- Rosseel Y (2012). lavaan: An R Package for Structural Equation Modeling. Journal of Statistical Software, 48(2), 1–36. 10.18637/jss.v048.i02. [DOI] [Google Scholar]
- Salthouse TA (1996). The processing-speed theory of adult age differences in cognition. Psychological Review, 103, 403–428. 10.1037/0033-295X.103.3.403 [DOI] [PubMed] [Google Scholar]
- Salthouse TA (2009). When does age-related cognitive decline begin? Neurobiology of Aging, 30(4), 507–514. 10.1016/j.neurobiolaging.2008.09.023 [DOI] [PMC free article] [PubMed] [Google Scholar]
- Salthouse T (2012). Consequences of age-related cognitive declines. Annual Review of Psychology, 63, 201–226. [DOI] [PMC free article] [PubMed] [Google Scholar]
- Salthouse TA (2014). Selectivity of attrition in longitudinal studies of cognitive functioning. The Journals of Gerontology: Series B: Psychological Sciences and Social Sciences, 69(4), 567–574. 10.1093/geronb/gbt046. [DOI] [PMC free article] [PubMed] [Google Scholar]
- Salthouse TA (2016). Continuity of cognitive change across adulthood. Psychonomic Bulletin & Review, 23(3), 932–939. 10.3758/s13423-015-0910-8. [DOI] [PMC free article] [PubMed] [Google Scholar]
- Salthouse TA, Babcock RL (1991). Decomposing adult age differences in working memory. Developmental Psychology, 27, 763–776. 10.1037/0012-1649.27.5.763. [DOI] [Google Scholar]
- Savalia NK, Agres PF, Chan MY, Feczko EJ, Kennedy KM, & Wig GS (2017). Motion-related artifacts in structural brain images revealed with independent estimates of in-scanner head motion. Human Brain Mapping, 38(1), 472–492. 10.1002/hbm.23397. [DOI] [PMC free article] [PubMed] [Google Scholar]
- Segonne F, Dale AM, Busa E, Glessner M, Salat D, Hahn HK, Fischl B, (2004). A hybrid approach to the skull stripping problem in MRI. Neuroimage, 22, 1060–1075. 10.1016/j.neuroimage.2004.03.032. [DOI] [PubMed] [Google Scholar]
- Srinivasan D, Erus G, Doshi J, Wolk DA, Shou H, Habes M, & Davatzikos C (2020). A comparison of freesurfer and multi-atlas MUSE for brain anatomy segmentation: Findings about size and age bias, and inter-scanner stability in multi-site aging studies. NeuroImage, 223. 10.1016/j.neuroimage.2020.117248 [DOI] [PMC free article] [PubMed] [Google Scholar]
- Stern Y (2009). Cognitive reserve. Neuropsychologia, 47(10), 2015–2028. [DOI] [PMC free article] [PubMed] [Google Scholar]
- Stern Y, Arenaza-Urquijo EM, Bartrés-Faz D, Belleville S, Cantilon M, Chetelat G, Ewers M, Franzmeier N, Kempermann G, Kremen WS, Okonkwo O, Scarmeas N, Soldan A, Udeh-Momoh C, Valenzuela M, Vemuri P, & Vuoksimaa E (2020). Whitepaper: Defining and investigating cognitive reserve, brain reserve, and brain maintenance. Alzheimer’s & Dementia : The Journal of the Alzheimer’s Association, 16(9), 1305–1311. 10.1016/j.jalz.2018.07.219 [DOI] [PMC free article] [PubMed] [Google Scholar]
- Terribilli D, Schaufelberger MS, Duran FLS, Zanetti MV, Curiati PK, Menezes PR, Scazufca M, Amaro E Jr., Leite CC, & Busatto GF (2011). Age-related gray matter volume changes in the brain during non-elderly adulthood. Neurobiology of Aging, 32(2), 354–368. 10.1016/j.neurobiolaging.2009.02.008. [DOI] [PMC free article] [PubMed] [Google Scholar]
- Verhaeghen P & Salthouse TA, (1997) Meta-analyses of age-cognition relations in adulthood: estimates of linear and nonlinear age effects and structural models. Psychological Bulletin, 122, 231–249. 10.1037/0033-2909.122.3.231. [DOI] [PubMed] [Google Scholar]
- Walhovd KB, Fjell AM, Giedd J, Dale AM, & Brown TT (2017). Through thick and thin: A need to reconcile contradictory results on trajectories in human cortical development. Cerebral Cortex, 27(2), 1472–1481. [DOI] [PMC free article] [PubMed] [Google Scholar]
- Wechsler D, (1997). WAIS-III: Administration and scoring manual: Wechsler Adult Intelligence Scale. San Antonio, TX: Psychological Corporation. [Google Scholar]
- Zhao L, Matloff W, Ning K, Kim H, Dinov ID, & Toga AW (2019). Age-related differences in brain morphology and the modifiers in middle-aged and older adults. Cerebral Cortex, 29(10), 4169–4193. 10.1093/cercor/bhy300. [DOI] [PMC free article] [PubMed] [Google Scholar]
- Zhou D, Lebel C, Treit S, Evans A, & Beaulieu C (2015). Accelerated longitudinal cortical thinning in adolescence. NeuroImage, 104, 138–145. 10.1016/j.neuroimage.2014.10.005. [DOI] [PubMed] [Google Scholar]
Associated Data
This section collects any data citations, data availability statements, or supplementary materials included in this article.
Supplementary Materials
Data Availability Statement
Data and analysis scripts used in this study are available upon request to the corresponding author, and the DLBS dataset will be made publicly available in the future.